
Concept explainers
Videos
For each data set in Exercises 2.26–2.31,
- a. determine a frequency distribution.
- b. obtain a relative-frequency distribution.
- c. draw a pie chart.
- d. construct a bar chart.
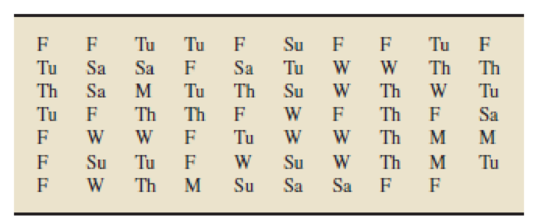
2.31 Road Rage. The report Controlling Road Rage: A Literature Review and Pilot Study was prepared for the AAA Foundation for Traffic Safety by D. Rathbone and J. Huckabee. The authors discuss the results of a literature review and pilot study on how to prevent aggressive driving and road rage. As described in the study, road rage is criminal behavior by motorists characterized by uncontrolled anger that results in violence or threatened violence on the road. One of the goals of the study was to determine when road rage occurs most often. The days on which 69 road rage incidents occurred are presented in the following table.
Want to see the full answer?
Check out a sample textbook solution
Chapter 2 Solutions
Introductory Statistics, Books a la Carte Plus NEW MyLab Statistics with Pearson eText -- Access Card Package (10th Edition)


 Glencoe Algebra 1, Student Edition, 9780079039897...AlgebraISBN:9780079039897Author:CarterPublisher:McGraw Hill