
Introductory Statistics, Books a la Carte Plus NEW MyLab Statistics with Pearson eText -- Access Card Package (10th Edition)
10th Edition
ISBN: 9780134270364
Author: Neil A. Weiss
Publisher: PEARSON
expand_more
expand_more
format_list_bulleted
Videos
Textbook Question
Chapter 2.3, Problem 98E
Process Capability. R. Morris and E. Watson studied various aspects of process capability in the paper “Determining Process Capability in a Chemical Batch Process” (Quality Engineering, Vol. 10(2), pp. 389–396). In one part of the study, the researchers compared the variability in product of a particular piece of equipment to a known analytic capability to decide whether product consistency could be improved. The following data were obtained for 10 batches of product.
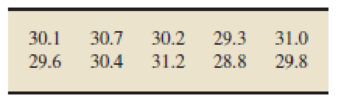
Construct a stem-and-leaf diagram for these data with
- a. one line per stem.
- b. two lines per stem.
- c. Which stem-and-leaf diagram do you find more useful? Why?
Expert Solution & Answer
Want to see the full answer?
Check out a sample textbook solution
Students have asked these similar questions
Suppose that as part of a research methods class, Bailey was asked to write summaries of research papers on
the following topics.
• The effects of increasing temperatures on the migration patterns of birds
• The effects of media coverage on community support for crime prevention
For each topic, identify the explanatory and the response variables.
Temperature and the level of community support for crime prevention are the explanatory variables, and
the amount of media coverage and the migration patterns of birds are the response variables.
Temperature and the amount of media coverage are the response variables, and the migration patterns of
birds and the level of community support for crime prevention are the explanatory variables.
Temperature and the amount of media coverage are the explanatory variables, and the migration patterns
of birds and the level of community support for crime prevention are the response variables.
Temperature and the migration patterns of birds are the…
A sociologist was hired by a large city hospital to investigate the relationship between the number of unauthorized days that employees are absent per year and the distance (miles) between home and work
for the employees. A sample of 10 employees was chosen, and the following data were collected.
Number of Days
Absent
Distance to Work
(miles)
4
4
7
6.
8
8
7
10
4
12
4
14
1
14
3
18
1
(a) Develop a scatter chart for these data with distance to work (in miles) as the independent variable and number of days absent as the dependent variable. Does a linear relationship appear reasonable?
Explain.
O Yes, there appears to be a positive linear relationship between distance to work (miles) and number of days absent.
O Yes, there appears to be a negative linear relationship between distance to work (miles) and number of days absent.
O No, there appears to be no noticeable linear relationship between distance to work (miles) and number of days absent.
(b) Use the data to develop an estimated…
Hair and Eye Color. In the article “Graphical Display of Two- Way Contingency Tables” (The American Statistician, Vol. 28, No. 1, pp. 9–12), R. Snee presented data on hair color and eye color among 592 students in an elementary statistics course at the University of Delaware. Raw data for that information are presented on the WeissStats site. Use the technology of your choice to do the following tasks, and interpret your results.
a. Obtain both a frequency distribution and a relative-frequency distribution for the hair-color data.
b. Get a pie chart of the hair-color data.
c. Determine a bar chart of the hair-color data.
d. Repeat parts (a)–(c) for the eye-color data.
Chapter 2 Solutions
Introductory Statistics, Books a la Carte Plus NEW MyLab Statistics with Pearson eText -- Access Card Package (10th Edition)
Ch. 2.1 - Give an example, other than those presented in...Ch. 2.1 - Explain the meaning of a. qualitative variable. b....Ch. 2.1 - Explain the meaning of a. qualitative data. b....Ch. 2.1 - Provide a reason why the classification of data is...Ch. 2.1 - Of the variables you have studied so far, which...Ch. 2.1 - For each part of Exercises 2.62.11, classify the...Ch. 2.1 - Earthquakes. The U.S. Geological Survey monitors...Ch. 2.1 - Top 10 IPOs. An online article from the Washington...Ch. 2.1 - Earnings from the Crypt. On the Celebrity NetWorth...Ch. 2.1 - World University Rankings. The Times Higher...
Ch. 2.1 - Recording Industry Statistics. The Recording...Ch. 2.1 - RBI Kings. As reported on MLB.com, the five...Ch. 2.1 - Top Broadcast Shows. As reported in Primetime...Ch. 2.1 - The Fulbright Program. The U.S. governments...Ch. 2.1 - Top 10 Green Cars. The following table presents...Ch. 2.1 - Ordinal Data. Another important type of data is...Ch. 2.2 - What is a frequency distribution of qualitative...Ch. 2.2 - Explain the difference between a. frequency and...Ch. 2.2 - Answer true or false to each of the statements in...Ch. 2.2 - In Exercises 2.202.25, we have presented some...Ch. 2.2 - Prob. 21ECh. 2.2 - In Exercises 2.202.25, we have presented some...Ch. 2.2 - Prob. 23ECh. 2.2 - In Exercises 2.202.25, we have presented some...Ch. 2.2 - In Exercises 2.202.25, we have presented some...Ch. 2.2 - For each data set in Exercises 2.262.31, a....Ch. 2.2 - For each data set in Exercises 2.262.31, a....Ch. 2.2 - For each data set in Exercises 2.262.31, a....Ch. 2.2 - For each data set in Exercises 2.262.31, a....Ch. 2.2 - For each data set in Exercises 2.262.31, a....Ch. 2.2 - For each data set in Exercises 2.262.31, a....Ch. 2.2 - In each of Exercises 2.322.37, we have presented a...Ch. 2.2 - In each of Exercises 2.322.37, we have presented a...Ch. 2.2 - In each of Exercises 2.322.37, we have presented a...Ch. 2.2 - In each of Exercises 2.322.37, we have presented a...Ch. 2.2 - In each of Exercises 2.322.37, we have presented a...Ch. 2.2 - Prob. 37ECh. 2.2 - Health Status. The National Center for Health...Ch. 2.2 - In Exercises 2.392.41, use the technology of your...Ch. 2.2 - Prob. 40ECh. 2.2 - In Exercises 2.392.41, use the technology of your...Ch. 2.3 - Identify an important reason for grouping data.Ch. 2.3 - Do the concepts of class limits, marks, cutpoints,...Ch. 2.3 - State three of the most important guidelines in...Ch. 2.3 - With regard to grouping quantitative data into...Ch. 2.3 - For quantitative data, we examined three types of...Ch. 2.3 - We used slightly different methods for determining...Ch. 2.3 - Explain the difference between a frequency...Ch. 2.3 - Explain the advantages and disadvantages of...Ch. 2.3 - For data that are grouped in classes based on more...Ch. 2.3 - Discuss the relative advantages and disadvantages...Ch. 2.3 - Suppose that you have a data set that contains a...Ch. 2.3 - Suppose that you have constructed a stem-and-leaf...Ch. 2.3 - In each of Exercises 2.542.59, we have presented a...Ch. 2.3 - In each of Exercises 2.542.59, we have presented a...Ch. 2.3 - In each of Exercises 2.542.59, we have presented a...Ch. 2.3 - In each of Exercises 2.542.59, we have presented a...Ch. 2.3 - Prob. 58ECh. 2.3 - In each of Exercises 2.542.59, we have presented a...Ch. 2.3 - Prob. 60ECh. 2.3 - Prob. 61ECh. 2.3 - In Exercises 2.602.71, we have presented some...Ch. 2.3 - In Exercises 2.602.71, we have presented some...Ch. 2.3 - In Exercises 2.602.71, we have presented some...Ch. 2.3 - In Exercises 2.602.71, we have presented some...Ch. 2.3 - Prob. 66ECh. 2.3 - In Exercises 2.602.71, we have presented some...Ch. 2.3 - In Exercises 2.602.71, we have presented some...Ch. 2.3 - Prob. 69ECh. 2.3 - In Exercises 2.602.71, we have presented some...Ch. 2.3 - In Exercises 2.602.71, we have presented some...Ch. 2.3 - Prob. 72ECh. 2.3 - In each of Exercises 2.722.75, construct a dotplot...Ch. 2.3 - Prob. 74ECh. 2.3 - In each of Exercises 2.722.75, construct a dotplot...Ch. 2.3 - In each of Exercises 2.762.79, construct a...Ch. 2.3 - Prob. 77ECh. 2.3 - In each of Exercises 2.762.79, construct a...Ch. 2.3 - Prob. 79ECh. 2.3 - Prob. 80ECh. 2.3 - For each data set in Exercises 2.802.91, use the...Ch. 2.3 - For each data set in Exercises 2.802.91, use the...Ch. 2.3 - For each data set in Exercises 2.802.91, use the...Ch. 2.3 - For each data set in Exercises 2.802.91, use the...Ch. 2.3 - For each data set in Exercises 2.802.91, use the...Ch. 2.3 - For each data set in Exercises 2.802.91, use the...Ch. 2.3 - Prob. 87ECh. 2.3 - Prob. 88ECh. 2.3 - Prob. 89ECh. 2.3 - Prob. 90ECh. 2.3 - Prob. 91ECh. 2.3 - Prob. 92ECh. 2.3 - Age of Passenger Cars. According to R. L. Polk ...Ch. 2.3 - Stressed-Out Bus Drivers. Frustrated passengers,...Ch. 2.3 - Acute Postoperative Days. Several neurosurgeons...Ch. 2.3 - MMs. In the article Sweetening StatisticsWhat MMs...Ch. 2.3 - Women in the Workforce. In an issue of Science...Ch. 2.3 - Process Capability. R. Morris and E. Watson...Ch. 2.3 - University Patents. The number of patents a...Ch. 2.3 - Prob. 100ECh. 2.3 - Prob. 101ECh. 2.3 - Adjusted Gross Incomes. The Internal Revenue...Ch. 2.3 - Cholesterol Levels. According to the National...Ch. 2.3 - Hospital Beds. The number of hospital beds...Ch. 2.3 - Parkinsons Disease. Parkinsons disease affects...Ch. 2.3 - The Great White Shark. In an article titled Great...Ch. 2.3 - The Beatles. In the article, Length of The Beatles...Ch. 2.3 - High School Completion. As reported by the U.S....Ch. 2.3 - Prob. 109ECh. 2.3 - Body Temperature. A study by researchers at the...Ch. 2.3 - Exam Scores. The exam scores for the students in...Ch. 2.3 - Prob. 112ECh. 2.3 - Prob. 113ECh. 2.3 - Age and Gender. The following bivariate data on...Ch. 2.3 - Prob. 115ECh. 2.3 - Clocking the Cheetah. Construct a...Ch. 2.3 - Prob. 117ECh. 2.3 - Residential Energy Consumption. Refer to the...Ch. 2.3 - Prob. 119ECh. 2.3 - Cardiovascular Hospitalizations. The Florida State...Ch. 2.3 - Prob. 121ECh. 2.4 - In each of Exercises 2.1222.127, explain the...Ch. 2.4 - In each of Exercises 2.1222.127, explain the...Ch. 2.4 - In each of Exercises 2.1222.127, explain the...Ch. 2.4 - Prob. 125ECh. 2.4 - Prob. 126ECh. 2.4 - Prob. 127ECh. 2.4 - Prob. 128ECh. 2.4 - Suppose that a variable of a population has a...Ch. 2.4 - Prob. 130ECh. 2.4 - Identify and sketch three distribution shapes that...Ch. 2.4 - Prob. 132ECh. 2.4 - In each of Exercises 2.1322.139, we have drawn a...Ch. 2.4 - In each of Exercises 2.1322.139, we have drawn a...Ch. 2.4 - In each of Exercises 2.1322.139, we have drawn a...Ch. 2.4 - In each of Exercises 2.1322.139, we have drawn a...Ch. 2.4 - In each of Exercises 2.1322.139, we have drawn a...Ch. 2.4 - In each of Exercises 2.1322.139, we have drawn a...Ch. 2.4 - Prob. 139ECh. 2.4 - In each of Exercises 2.1402.149, we have provided...Ch. 2.4 - In each of Exercises 2.1402.149, we have provided...Ch. 2.4 - Prob. 142ECh. 2.4 - In each of Exercises 2.1402.149, we have provided...Ch. 2.4 - In each of Exercises 2.1402.149, we have provided...Ch. 2.4 - In each of Exercises 2.1402.149, we have provided...Ch. 2.4 - In each of Exercises 2.1402.149, we have provided...Ch. 2.4 - Prob. 147ECh. 2.4 - Prob. 148ECh. 2.4 - Prob. 149ECh. 2.4 - Old Faithful. Old Faithful is a geyser in...Ch. 2.4 - SnowGoose Nests. In the article Trophic...Ch. 2.4 - Prob. 152ECh. 2.4 - In each of Exercises 2.1522.157, a. use the...Ch. 2.4 - In each of Exercises 2.1522.157, a. use the...Ch. 2.4 - Prob. 155ECh. 2.4 - In each of Exercises 2.1522.157, a. use the...Ch. 2.4 - In each of Exercises 2.1522.157, a. use the...Ch. 2.4 - Standard Normal Distribution. One of the most...Ch. 2.5 - Give one reason why constructing and reading...Ch. 2.5 - Prob. 163ECh. 2.5 - Reading Skills. Each year the director of the...Ch. 2.5 - Americas Melting Pot. The U.S. Census Bureau...Ch. 2.5 - Prob. 167ECh. 2.5 - Drunk-Driving Fatalities. Drunk-driving fatalities...Ch. 2.5 - Prob. 169ECh. 2.5 - Prob. 170ECh. 2.5 - Prob. 171ECh. 2 - This problem is about variables. a. What is a...Ch. 2 - This problem is about data. a. What are data? b....Ch. 2 - For a qualitative data set, what is a a. frequency...Ch. 2 - What is the relationship between a frequency or...Ch. 2 - Identify two main types of graphical displays that...Ch. 2 - In a bar chart, unlike in a histogram, the bars do...Ch. 2 - Some users of statistics prefer pie charts to bar...Ch. 2 - When is the use of single-value grouping...Ch. 2 - A quantitative data set has been grouped by using...Ch. 2 - A quantitative data set has been grouped by using...Ch. 2 - A quantitative data set has been grouped by using...Ch. 2 - A quantitative data set has been grouped by using...Ch. 2 - Explain the relative positioning of the bars in a...Ch. 2 - Sketch the curve corresponding to each of the...Ch. 2 - Draw a smooth curve that represents a symmetric...Ch. 2 - Prob. 16RPCh. 2 - Largest Hydroelectric Plants. According to...Ch. 2 - DVD Players. Refer to Example 2.16 on page 60. a....Ch. 2 - Inauguration Ages. From the Information Please...Ch. 2 - Inauguration Ages. Refer to Problem 19. Construct...Ch. 2 - Prob. 21RPCh. 2 - Prob. 22RPCh. 2 - Busy Bank Tellers. The Prescott National Bank has...Ch. 2 - On-Time Arrivals. The Air Travel Consumer Report...Ch. 2 - Old Ballplayers. From the ESPN Web site, we...Ch. 2 - Prob. 26RPCh. 2 - U.S. Divisions. The U.S. Census Bureau divides the...Ch. 2 - Prob. 28RPCh. 2 - Prob. 29RPCh. 2 - Hair and Eye Color. In the article Graphical...Ch. 2 - Prob. 31RPCh. 2 - In Problems 3133, a. identify the population and...Ch. 2 - In Problems 3133, a. identify the population and...Ch. 2 - UWEC UNDERGRADUATES Recall from Chapter 1 (see...Ch. 2 - Recall that, each year, Forbes magazine publishes...
Knowledge Booster


Learn more about
Need a deep-dive on the concept behind this application? Look no further. Learn more about this topic, statistics and related others by exploring similar questions and additional content below.Similar questions
- Urban Travel Times Population of cities and driving times are related, as shown in the accompanying table, which shows the 1960 population N, in thousands, for several cities, together with the average time T, in minutes, sent by residents driving to work. City Population N Driving time T Los Angeles 6489 16.8 Pittsburgh 1804 12.6 Washington 1808 14.3 Hutchinson 38 6.1 Nashville 347 10.8 Tallahassee 48 7.3 An analysis of these data, along with data from 17 other cities in the United States and Canada, led to a power model of average driving time as a function of population. a Construct a power model of driving time in minutes as a function of population measured in thousands b Is average driving time in Pittsburgh more or less than would be expected from its population? c If you wish to move to a smaller city to reduce your average driving time to work by 25, how much smaller should the city be?arrow_forwardA cohort study was undertaken to test for association between arteriolosclerosis (hardening of the arterioles) and secondary hypertension. The data were split into 2 groups: subjects who had been treated with nonsteroidal anti-inflammatory drugs (NSAIDS) and those who had not. The stratified data are shown in Table 3: Treated with NSAIDS Exposure Category Secondary Hypertension No Secondary Hypertension Total Not Treated with NSAIDS Exposure Category Secondary Hypertension No Secondary Hypertension Total Table 3 Arteriolosclerosis 46 23 69 Arteriolosclerosis 79 25 104 No Arteriolosclerosis 251 724 975 No Arteriolosclerosis 405 446 851 Total 297 747 1044 Total 484 471 955 Obtain the stratum-specific odds ratios for the 2 groups and the odds ratio for the aggregate data. Comment on the association between arteriolosclerosis and secondary hypertension and the role played by NSAIDS in this association.arrow_forwardA local company of sales professionals in Abu Dhabi conducted a survey of its employees to study the relationship, if any, between the years of experience and salary for individuals employed inside and outside sales positions. On the survey, respondents were asked to specify one of three levels of years of experience: low (1-10 years), medium (11-20 years), and high (21 or more years). The complete data set, consisting of 133 observations Is the salesperson position dependent (related to) on the salesperson experience? Use a 0.05 level of significance- by using chi-square test give recommendations for the company of sales professionals in Abu Dhabi to be better easy to answer it plz Observation Salary (AED) Position Experience 1 173154 Inside Low 2 145863 Inside Low 3 166896 Inside Low 4 155844 Inside Low 5 160392 Inside Low 6 158499 Inside Low 7 167877 Inside Low 8 191397 Inside Low 9 162366 Inside Low 10 176442 Inside Low 11 177828 Inside Low 12…arrow_forward
- Suppose that, as part of a research methods class, Bailey was asked to write a summary of a research paper on the topic of the effects of oil contamination in soil on seed germination rates. Identify the explanatory and the response variables.arrow_forwardA) Classify the following data as either qualitative data or quantitative data. In addition, classify the quantitative data as discrete or continuous. The number of times that a movement authority is sent to a train from a relay station is recorded for several trains Over a three-week period. The movement authority, which is an electronic transmission, is sent repeatedly until a return signal is received from the train. 1. 2. A physician records the follow-up condition of patients with optic neuritis as improved, unchanged, or worse. The individuals in a sociological study are classified into one of five income classes as follows: low, low to middle Middle, middle to upper, or upper. 3.arrow_forwardThe St. Lucian Government is interested in predicting the number of weekly riders on the public buses using the following variables: • Price of bus trips ~er week • The population in the city • The monthly income of riders • Average rate to park your personal vehicle Number of weekly riders 192,000 Population of city 1,800,000 1,790,000 Price per week Monthly income of riders Average parking rates per month City $15 $5,800 $50 $6,200 $50 190,400 191,200 $15 $15 1,780,000 $6,400 $60 4 $25 $6,500 $60 177,600 176,800 1,778,000 1,750,000 1,740,000 5 $25 $6,550 $60 6. 178,400 $25 $6,580 $70 7 180,800 $25 1,725,000 $8,200 $75 175,200 174,400 $30 $30 1,725,000 $8,600 $8,800 8 $75 9. 1,720,000 $75 10 173,920 $30 1,705,000 $80 $9,200 $9,630 $10,570 $11,330 $11,600 S11,800 $11,830 $12,650 S13.000 1,710,000 1,700,000 11 172,800 163,200 $30 $80 12 $40 $80 13 161,600 $40 1,695,000 1,695,000 1,690,000 $85 14 161,600 160,800 $40 $100 15 $40 $105 1,630,000 1,640,000 1,635,000 16 159,200 $40 $105 17…arrow_forward
- An advertising agency has been hired by a manufacturer of pens to develop an advertising campaign for the upcoming holiday season. To prepare for this project, the research director decides to initiate a study of the effect of advertising on product perception. An experiment is designed to compare five different advertisements. 5 Advertisement A: greatly undersells the pen's characteristics. Advertisement B: slightly undersells the pen's characteristics. Advertisement C: slightly oversells the pen's characteristics. Advertisement D: greatly oversells the pen's characteristics. Advertisement E: attempts to correctly stat the pen's characteristics. A sample of 25 adults respondents, taken from a larger focus group, is randomly assigned to the five advertisements (so that there are five respondents to each). After reading the advertisement and developing a sense of "product expectation," all respondents unknowingly receive the same pen to evaluate. The respondents are permitted to test…arrow_forwardStatistics and Data Analysisarrow_forwardA research group is interested in the relationship between exposure to mold in households after a major hurricane and the onset of acute respiratory illness in children. Suppose an observational study is conducted over 10 years following the natural disaster and the following two-by-two table was created in order to address the relationship between exposure and outcome. Acute Respiratory Illness No Acute Respiratory Illness Total Mold 378 156 534 No Mold 73 260 333 Total 451 416 867 Calculate the incidence of acute respiratory illness in the exposed and unexposed. Calculate the relative risk for ARI due to exposure in this study Interpret your findings from part Barrow_forward
- Neurosurgery Operative Times. An Arizona State University professor, R. Jacobowitz, Ph.D., in consultation with G. Vishteh, M.D., and other neurosurgeons obtained data on operative times, in minutes, for both a dynamic system (Z-plate) and a static system (ALPS plate). They wanted to perform a hypothesis test to decide whether the mean operative time is less with the dynamic system than with the static system. a. identify the variable. b. identify the two populations. c. determine the null and alternative hypotheses. d. classify the hypothesis test as two tailed, left tailed, or right tailed.arrow_forwardThe St. Lucian Government is interested in predicting the number of weekly riders on the public buses using the following variables: • Price of bus trips rer week • The population in the city • The monthly income of riders • Average rate to park your personal vehicle Number of weekly riders 192,000 Price per week Population of city 1,800,000 Monthly income of riders Average parking rates per month City $15 $5,800 $50 $6,200 $6,400 $6,500 $50 $60 190,400 $15 1,790,000 191,200 $15 1,780,000 4 $25 $60 177,600 176,800 1,778,000 $25 $6,550 $60 $70 5 1,750,000 1,740,000 6. 178,400 $25 $6,580 180,800 $25 1,725,000 $8,200 $75 175,200 174,400 $30 $30 1,725,000 $8,600 $8,800 8 $75 9. 1,720,000 $75 173,920 172,800 163,200 10 $30 $80 1,705,000 1,710,000 1,700,000 $9,200 $9,630 $10,570 11 $30 $80 12 $40 $80 $11,330 $11,600 S11,800 13 161,600 $40 1,695,000 1,695,000 $85 14 161,600 160,800 $40 $100 15 $40 1,690,000 $105 $40 1,630,000 1,640,000 1,635,000 S11,830 $12.650 S13.000 16 159,200 $105 17…arrow_forwardThe authors of a paper compared two different methods for measuring body fat percentage. One method uses ultrasound, and the other method uses X-ray technology. Body fat percentages using each of these methods for 16 athletes (a subset of the data given in a graph that appeared in the paper) are given in the accompanying table. You can assume that the 16 athletes who participated in this study are representative of the population of athletes. Athlete X-ray Ultrasound 1 5.00 4.25 2 16.00 12.75 3 9.25 9.00 4 12.00 11.75 5 17.25 17.00 6 29.50 27.50 7 5.50 6.50 8 6.00 6.75 9 8.00 8.75 10 9.50 10.50 11 9.25 9.50 12 11.00 12.00 13 12.00 12.25 14 14.00 15.50 15 17.00 18.00 16 18.00 18.25 Use these data to estimate the difference in mean body fat percentage measurement for the two methods. Use a confidence level of 95%. (Use ?d = ?X-ray − ?ultrasound. Round your answers to three decimal places.) , % Interpret the interval in context.…arrow_forward
arrow_back_ios
SEE MORE QUESTIONS
arrow_forward_ios
Recommended textbooks for you
 Functions and Change: A Modeling Approach to Coll...AlgebraISBN:9781337111348Author:Bruce Crauder, Benny Evans, Alan NoellPublisher:Cengage Learning
 Big Ideas Math A Bridge To Success Algebra 1: Stu...AlgebraISBN:9781680331141Author:HOUGHTON MIFFLIN HARCOURTPublisher:Houghton Mifflin Harcourt
 Glencoe Algebra 1, Student Edition, 9780079039897...AlgebraISBN:9780079039897Author:CarterPublisher:McGraw Hill
Functions and Change: A Modeling Approach to Coll...
Algebra
ISBN:9781337111348
Author:Bruce Crauder, Benny Evans, Alan Noell
Publisher:Cengage Learning
Big Ideas Math A Bridge To Success Algebra 1: Stu...
Algebra
ISBN:9781680331141
Author:HOUGHTON MIFFLIN HARCOURT
Publisher:Houghton Mifflin Harcourt
Glencoe Algebra 1, Student Edition, 9780079039897...
Algebra
ISBN:9780079039897
Author:Carter
Publisher:McGraw Hill
F- Test or F- statistic (F- Test of Equality of Variance); Author: Prof. Arvind Kumar Sing;https://www.youtube.com/watch?v=PdUt7InTyc8;License: Standard Youtube License
Statistics 101: F-ratio Test for Two Equal Variances; Author: Brandon Foltz;https://www.youtube.com/watch?v=UWQO4gX7-lE;License: Standard YouTube License, CC-BY
Hypothesis Testing and Confidence Intervals (FRM Part 1 – Book 2 – Chapter 5); Author: Analystprep;https://www.youtube.com/watch?v=vth3yZIUlGQ;License: Standard YouTube License, CC-BY
Understanding the Levene's Test for Equality of Variances in SPSS; Author: Dr. Todd Grande;https://www.youtube.com/watch?v=udJr8V2P8Xo;License: Standard Youtube License