
Introductory Statistics, Books a la Carte Plus NEW MyLab Statistics with Pearson eText -- Access Card Package (10th Edition)
10th Edition
ISBN: 9780134270364
Author: Neil A. Weiss
Publisher: PEARSON
expand_more
expand_more
format_list_bulleted
Concept explainers
Videos
Textbook Question
Chapter 2, Problem 27RP
U.S. Divisions. The U.S. Census Bureau divides the states in the United States into nine divisions: East North Central (ENC), East South Central (ESC), Middle Atlantic (MAC), Mountain (MTN), New England (NED), Pacific (PAC), South Atlantic (SAC), West North Central (WNC), and West South Central (WSC). The following table gives the divisions of each of the 50 states.
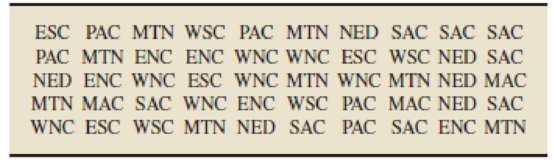
- a. Identify the population and variable under consideration.
- b. Obtain both a frequency distribution and a relative-frequency distribution of the divisions.
- c. Draw a pie chart of the divisions.
- d. Construct a bar chart of the divisions.
- e. Interpret your results.
Expert Solution & Answer
Want to see the full answer?
Check out a sample textbook solution
Students have asked these similar questions
mpie
(including the District of Columbia).
Pacific
177,336
West South
Central
229,634
Mountain
89,816
West North
68,440
64,564
East North
26,384
East South
Central
Central
Central
South
8,579
376,034
Middle
41,441
New England
Atlantic
Atlantic
Source: U.S. Census Bureau, Statistical Abstract of the United States: 2012, Table 508 (data) and U.S. Census
Bureau, Census Regions and Divisions of the United States (regions).
a. Calculate the mean and standard deviation for the population.
4-
Which one of the following factors refers to social demography?
a.
Structure of the Population
b.
Structure of the Organization
c.
Structure of the College
d.
Structure of the Students
The table below gives the population by sex and year of the four regions of Mälardalen over the
period 2015-2021 (the data is from SCB).
Närke
men
women
Södermanland
men
women
Västmanland
men
women
Uppland
men
women
Population by region, sex and year
2015 2016 2017 2018 2019 2020 2021
102 102 103 913 106 092 107 941 109 345 110 020 110 558
103 189 104 463 106 501 108 245 109 435 109 970 110 573
648 022 658 795 669 369 680 420 689 201 692 993 697 688
653 006 661 682 670 687 679 901 688 047 691 637 696 084
153 529 155 770 157 521 158 913 159 919 160 476 161 286
151 983 153 587 154 964 156 087 156 993 157 388 158 187
782 653 799 121 816 230 830 513 844 560 851 677 863 723
790 143 803 531 817 405 829 911 841 911 849 121 860 042
A. For each of the groups, do a scatter plot. For which cases does the plots suggest the use of a
simple linear regression model?
B. Calculate estimates of the slopes and intercepts of the regression lines.
C. Calculate estimates of the standard deviations.
D.…
Chapter 2 Solutions
Introductory Statistics, Books a la Carte Plus NEW MyLab Statistics with Pearson eText -- Access Card Package (10th Edition)
Ch. 2.1 - Give an example, other than those presented in...Ch. 2.1 - Explain the meaning of a. qualitative variable. b....Ch. 2.1 - Explain the meaning of a. qualitative data. b....Ch. 2.1 - Provide a reason why the classification of data is...Ch. 2.1 - Of the variables you have studied so far, which...Ch. 2.1 - For each part of Exercises 2.62.11, classify the...Ch. 2.1 - Earthquakes. The U.S. Geological Survey monitors...Ch. 2.1 - Top 10 IPOs. An online article from the Washington...Ch. 2.1 - Earnings from the Crypt. On the Celebrity NetWorth...Ch. 2.1 - World University Rankings. The Times Higher...
Ch. 2.1 - Recording Industry Statistics. The Recording...Ch. 2.1 - RBI Kings. As reported on MLB.com, the five...Ch. 2.1 - Top Broadcast Shows. As reported in Primetime...Ch. 2.1 - The Fulbright Program. The U.S. governments...Ch. 2.1 - Top 10 Green Cars. The following table presents...Ch. 2.1 - Ordinal Data. Another important type of data is...Ch. 2.2 - What is a frequency distribution of qualitative...Ch. 2.2 - Explain the difference between a. frequency and...Ch. 2.2 - Answer true or false to each of the statements in...Ch. 2.2 - In Exercises 2.202.25, we have presented some...Ch. 2.2 - Prob. 21ECh. 2.2 - In Exercises 2.202.25, we have presented some...Ch. 2.2 - Prob. 23ECh. 2.2 - In Exercises 2.202.25, we have presented some...Ch. 2.2 - In Exercises 2.202.25, we have presented some...Ch. 2.2 - For each data set in Exercises 2.262.31, a....Ch. 2.2 - For each data set in Exercises 2.262.31, a....Ch. 2.2 - For each data set in Exercises 2.262.31, a....Ch. 2.2 - For each data set in Exercises 2.262.31, a....Ch. 2.2 - For each data set in Exercises 2.262.31, a....Ch. 2.2 - For each data set in Exercises 2.262.31, a....Ch. 2.2 - In each of Exercises 2.322.37, we have presented a...Ch. 2.2 - In each of Exercises 2.322.37, we have presented a...Ch. 2.2 - In each of Exercises 2.322.37, we have presented a...Ch. 2.2 - In each of Exercises 2.322.37, we have presented a...Ch. 2.2 - In each of Exercises 2.322.37, we have presented a...Ch. 2.2 - Prob. 37ECh. 2.2 - Health Status. The National Center for Health...Ch. 2.2 - In Exercises 2.392.41, use the technology of your...Ch. 2.2 - Prob. 40ECh. 2.2 - In Exercises 2.392.41, use the technology of your...Ch. 2.3 - Identify an important reason for grouping data.Ch. 2.3 - Do the concepts of class limits, marks, cutpoints,...Ch. 2.3 - State three of the most important guidelines in...Ch. 2.3 - With regard to grouping quantitative data into...Ch. 2.3 - For quantitative data, we examined three types of...Ch. 2.3 - We used slightly different methods for determining...Ch. 2.3 - Explain the difference between a frequency...Ch. 2.3 - Explain the advantages and disadvantages of...Ch. 2.3 - For data that are grouped in classes based on more...Ch. 2.3 - Discuss the relative advantages and disadvantages...Ch. 2.3 - Suppose that you have a data set that contains a...Ch. 2.3 - Suppose that you have constructed a stem-and-leaf...Ch. 2.3 - In each of Exercises 2.542.59, we have presented a...Ch. 2.3 - In each of Exercises 2.542.59, we have presented a...Ch. 2.3 - In each of Exercises 2.542.59, we have presented a...Ch. 2.3 - In each of Exercises 2.542.59, we have presented a...Ch. 2.3 - Prob. 58ECh. 2.3 - In each of Exercises 2.542.59, we have presented a...Ch. 2.3 - Prob. 60ECh. 2.3 - Prob. 61ECh. 2.3 - In Exercises 2.602.71, we have presented some...Ch. 2.3 - In Exercises 2.602.71, we have presented some...Ch. 2.3 - In Exercises 2.602.71, we have presented some...Ch. 2.3 - In Exercises 2.602.71, we have presented some...Ch. 2.3 - Prob. 66ECh. 2.3 - In Exercises 2.602.71, we have presented some...Ch. 2.3 - In Exercises 2.602.71, we have presented some...Ch. 2.3 - Prob. 69ECh. 2.3 - In Exercises 2.602.71, we have presented some...Ch. 2.3 - In Exercises 2.602.71, we have presented some...Ch. 2.3 - Prob. 72ECh. 2.3 - In each of Exercises 2.722.75, construct a dotplot...Ch. 2.3 - Prob. 74ECh. 2.3 - In each of Exercises 2.722.75, construct a dotplot...Ch. 2.3 - In each of Exercises 2.762.79, construct a...Ch. 2.3 - Prob. 77ECh. 2.3 - In each of Exercises 2.762.79, construct a...Ch. 2.3 - Prob. 79ECh. 2.3 - Prob. 80ECh. 2.3 - For each data set in Exercises 2.802.91, use the...Ch. 2.3 - For each data set in Exercises 2.802.91, use the...Ch. 2.3 - For each data set in Exercises 2.802.91, use the...Ch. 2.3 - For each data set in Exercises 2.802.91, use the...Ch. 2.3 - For each data set in Exercises 2.802.91, use the...Ch. 2.3 - For each data set in Exercises 2.802.91, use the...Ch. 2.3 - Prob. 87ECh. 2.3 - Prob. 88ECh. 2.3 - Prob. 89ECh. 2.3 - Prob. 90ECh. 2.3 - Prob. 91ECh. 2.3 - Prob. 92ECh. 2.3 - Age of Passenger Cars. According to R. L. Polk ...Ch. 2.3 - Stressed-Out Bus Drivers. Frustrated passengers,...Ch. 2.3 - Acute Postoperative Days. Several neurosurgeons...Ch. 2.3 - MMs. In the article Sweetening StatisticsWhat MMs...Ch. 2.3 - Women in the Workforce. In an issue of Science...Ch. 2.3 - Process Capability. R. Morris and E. Watson...Ch. 2.3 - University Patents. The number of patents a...Ch. 2.3 - Prob. 100ECh. 2.3 - Prob. 101ECh. 2.3 - Adjusted Gross Incomes. The Internal Revenue...Ch. 2.3 - Cholesterol Levels. According to the National...Ch. 2.3 - Hospital Beds. The number of hospital beds...Ch. 2.3 - Parkinsons Disease. Parkinsons disease affects...Ch. 2.3 - The Great White Shark. In an article titled Great...Ch. 2.3 - The Beatles. In the article, Length of The Beatles...Ch. 2.3 - High School Completion. As reported by the U.S....Ch. 2.3 - Prob. 109ECh. 2.3 - Body Temperature. A study by researchers at the...Ch. 2.3 - Exam Scores. The exam scores for the students in...Ch. 2.3 - Prob. 112ECh. 2.3 - Prob. 113ECh. 2.3 - Age and Gender. The following bivariate data on...Ch. 2.3 - Prob. 115ECh. 2.3 - Clocking the Cheetah. Construct a...Ch. 2.3 - Prob. 117ECh. 2.3 - Residential Energy Consumption. Refer to the...Ch. 2.3 - Prob. 119ECh. 2.3 - Cardiovascular Hospitalizations. The Florida State...Ch. 2.3 - Prob. 121ECh. 2.4 - In each of Exercises 2.1222.127, explain the...Ch. 2.4 - In each of Exercises 2.1222.127, explain the...Ch. 2.4 - In each of Exercises 2.1222.127, explain the...Ch. 2.4 - Prob. 125ECh. 2.4 - Prob. 126ECh. 2.4 - Prob. 127ECh. 2.4 - Prob. 128ECh. 2.4 - Suppose that a variable of a population has a...Ch. 2.4 - Prob. 130ECh. 2.4 - Identify and sketch three distribution shapes that...Ch. 2.4 - Prob. 132ECh. 2.4 - In each of Exercises 2.1322.139, we have drawn a...Ch. 2.4 - In each of Exercises 2.1322.139, we have drawn a...Ch. 2.4 - In each of Exercises 2.1322.139, we have drawn a...Ch. 2.4 - In each of Exercises 2.1322.139, we have drawn a...Ch. 2.4 - In each of Exercises 2.1322.139, we have drawn a...Ch. 2.4 - In each of Exercises 2.1322.139, we have drawn a...Ch. 2.4 - Prob. 139ECh. 2.4 - In each of Exercises 2.1402.149, we have provided...Ch. 2.4 - In each of Exercises 2.1402.149, we have provided...Ch. 2.4 - Prob. 142ECh. 2.4 - In each of Exercises 2.1402.149, we have provided...Ch. 2.4 - In each of Exercises 2.1402.149, we have provided...Ch. 2.4 - In each of Exercises 2.1402.149, we have provided...Ch. 2.4 - In each of Exercises 2.1402.149, we have provided...Ch. 2.4 - Prob. 147ECh. 2.4 - Prob. 148ECh. 2.4 - Prob. 149ECh. 2.4 - Old Faithful. Old Faithful is a geyser in...Ch. 2.4 - SnowGoose Nests. In the article Trophic...Ch. 2.4 - Prob. 152ECh. 2.4 - In each of Exercises 2.1522.157, a. use the...Ch. 2.4 - In each of Exercises 2.1522.157, a. use the...Ch. 2.4 - Prob. 155ECh. 2.4 - In each of Exercises 2.1522.157, a. use the...Ch. 2.4 - In each of Exercises 2.1522.157, a. use the...Ch. 2.4 - Standard Normal Distribution. One of the most...Ch. 2.5 - Give one reason why constructing and reading...Ch. 2.5 - Prob. 163ECh. 2.5 - Reading Skills. Each year the director of the...Ch. 2.5 - Americas Melting Pot. The U.S. Census Bureau...Ch. 2.5 - Prob. 167ECh. 2.5 - Drunk-Driving Fatalities. Drunk-driving fatalities...Ch. 2.5 - Prob. 169ECh. 2.5 - Prob. 170ECh. 2.5 - Prob. 171ECh. 2 - This problem is about variables. a. What is a...Ch. 2 - This problem is about data. a. What are data? b....Ch. 2 - For a qualitative data set, what is a a. frequency...Ch. 2 - What is the relationship between a frequency or...Ch. 2 - Identify two main types of graphical displays that...Ch. 2 - In a bar chart, unlike in a histogram, the bars do...Ch. 2 - Some users of statistics prefer pie charts to bar...Ch. 2 - When is the use of single-value grouping...Ch. 2 - A quantitative data set has been grouped by using...Ch. 2 - A quantitative data set has been grouped by using...Ch. 2 - A quantitative data set has been grouped by using...Ch. 2 - A quantitative data set has been grouped by using...Ch. 2 - Explain the relative positioning of the bars in a...Ch. 2 - Sketch the curve corresponding to each of the...Ch. 2 - Draw a smooth curve that represents a symmetric...Ch. 2 - Prob. 16RPCh. 2 - Largest Hydroelectric Plants. According to...Ch. 2 - DVD Players. Refer to Example 2.16 on page 60. a....Ch. 2 - Inauguration Ages. From the Information Please...Ch. 2 - Inauguration Ages. Refer to Problem 19. Construct...Ch. 2 - Prob. 21RPCh. 2 - Prob. 22RPCh. 2 - Busy Bank Tellers. The Prescott National Bank has...Ch. 2 - On-Time Arrivals. The Air Travel Consumer Report...Ch. 2 - Old Ballplayers. From the ESPN Web site, we...Ch. 2 - Prob. 26RPCh. 2 - U.S. Divisions. The U.S. Census Bureau divides the...Ch. 2 - Prob. 28RPCh. 2 - Prob. 29RPCh. 2 - Hair and Eye Color. In the article Graphical...Ch. 2 - Prob. 31RPCh. 2 - In Problems 3133, a. identify the population and...Ch. 2 - In Problems 3133, a. identify the population and...Ch. 2 - UWEC UNDERGRADUATES Recall from Chapter 1 (see...Ch. 2 - Recall that, each year, Forbes magazine publishes...
Knowledge Booster


Learn more about
Need a deep-dive on the concept behind this application? Look no further. Learn more about this topic, statistics and related others by exploring similar questions and additional content below.Similar questions
- Best-Selling Albums. The Recording Industry Association of America provides data on the best-selling albums of all time. As of May 28, 2013, the top six best-selling albums of all time (U.S. sales only), are by the artists the Eagles (E), Michael Jackson (M), Pink Floyd (P), Led Zeppelin (L), AC/DC (A), and Billy Joel (B). a. List the 15 possible samples (without replacement) of two artists that can be selected from the six. For brevity, use the initial provided. b. Describe a procedure for taking a simple random sample of two artists from the six. c. If a simple random sampling procedure is used to obtain two artists, what are the chances of selecting P and A? M and E?arrow_forwardHere are the numbers of legal immigrants (in thousands) who settled in each state east of the Mississippi River from 2000 to 2007: Alabama 60.4 Connecticut 158.6 Delaware Illinois 23.4 Florida 997.9 Georgia Kentucky 316.8 459.9 Indiana 95.3 49.6 Maine 11.7 Maryland Mississippi New York 227.3 Massachusetts 274.2 Michigan New Jersey Ohio 186.4 21.6 New Hampshire North Carolina 19.7 444.9 992.6 253.3 134.9 Pennsylvania 204.2 Tennessee Rhode Island 32.9 South Carolina 73.0 102.0 Vermont 4.5 Virginia 268.4 West Virginia 7.0 Wisconsin -86.2 1. Make a histogram using Microsoft Excel or Google Sheets. 2. Answer the following questions. • True or False: The mean and standard deviation are more suitable numerical summaries than the five-number summary. • What is the median value (in thousands) of this distribution? • List the 5 number summary (in thousands) of this distribution. Edit View Insert Format Tools Tablearrow_forwardAndrew a sales representative of Data Network Company (DNC) must visit 6 towns within the coast province in the coming month. If there are nine major towns in the region to be visited, how many different groups of 6 are there that Andrew might visit?arrow_forward
- In 2010, the U.S. Congress passed the historic health care reform bill that will provide some type of coverage for the 32 million Americans currently without health care insurance. Just how widespread is the lack of medical coverage? The media claim that the segments of the population most at risk for disease and thus needing healthcare are women, children, the elderly and the poor. The following tables were generated from the U.S. Census Bureau, Current Population Survey, Annual Social and Economic Supplement (2011). Explain using supportive arguments from your analyses. Write a general summary paragraph identifying groups lacking in coverage by gender, age and income and commenting on the headline. Reference the observed numbers and percentages in your summary paragraph to see how the groups trend in identifying potentially more at-risk. Analysises for reference: Is being insured or not dependent on gender? Fill in the degrees of freedom and p-value in the output below and draw…arrow_forwardIn 2010, the U.S. Congress passed the historic health care reform bill that will provide some type of coverage for the 32 million Americans currently without health care insurance. Just how widespread is the lack of medical coverage? The media claim that the segments of the population most at risk for disease and thus needing healthcare are women, children, the elderly and the poor. The following tables were generated from the U.S. Census Bureau, Current Population Survey, Annual Social and Economic Supplement (2011). The tables report the number of uninsured (in thousands) by sex, by age, and by household income Is being insured or not dependent on the age groups identified in the analysis? Fill in the degrees of freedom and p-value in the output below and draw a clear conclusion indicating which age-groups are more at risk of not being insured if there is a significant relationshiparrow_forwardIn 2010, the U.S. Congress passed the historic health care reform bill that will provide some type of coverage for the 32 million Americans currently without health care insurance. Just how widespread is the lack of medical coverage? The media claim that the segments of the population most at risk for disease and thus needing healthcare are women, children, the elderly and the poor. The following tables were generated from the U.S. Census Bureau, Current Population Survey, Annual Social and Economic Supplement (2011). The tables report the number of uninsured (in thousands) by sex, by age, and by household income. Is being insured or not dependent on gender? Fill in the degrees of freedom and p-value in the output below and draw a clear conclusion indicating which gender is more at risk of not being insured if there is a significant difference.arrow_forward
- In 2010, the U.S. Congress passed the historic health care reform bill that will provide some type of coverage for the 32 million Americans currently without health care insurance. Just how widespread is the lack of medical coverage? The media claim that the segments of the population most at risk for disease and thus needing healthcare are women, children, the elderly and the poor. The following tables were generated from the U.S. Census Bureau, Current Population Survey, Annual Social and Economic Supplement (2011). The tables report the number of uninsured (in thousands) by sex, by age, and by household income Is being insured or not dependent on the income groups identified in the analysis? Fill in the degrees of freedom and p-value in the output below and draw a clear conclusion indicating which income-groups are more at risk of not being insured if there is a significant relationship.arrow_forwardA research company conducted a survey and collected demographic information on the respondents from each country. To the right is a table showing the number of people with various levels of education in five countries. Complete parts a) through d). Post- Country graduate College E Total 5 73 168 63 93 402 308 392 520 215 485 1920 Some high school 676 768 623 1250 885 4202 Primary or No less answer 516 320 231 32 79 1178 4 1509 41 1557 10 1552 1582 1549 7749 22 71 Total 47 narrow_forwardAn article reported the estimated percentage of U.S. households with only wireless phone service (no landline) for the 50 states and the District of Columbia. In the accompanying data table, each state was also classified into one of three geographical regions—West (W), Middle states (M), and East (E). Wireless % Region State Wireless % Region State 43.4 M AL 40.9 W MT 39.6 W AK 46.6 M NE 49.3 W AZ 48.5 W NV 56.2 M AR 43.5 M ND 42.9 W CA 31.2 E NH 50.5 W CO 25.2 E NJ 26.8 E CT 46.9 W NM 29.4 E DE 31.1 E NY 49.7 E DC 42.8 E NC 47.7 E FL 45.8 E OH 45.9 E GA 50.5 M OK 38.4 W HI 47.1 W OR 56.1 W ID 30.0 E PA 45.8 M IL 34.7 E RI 47.6 M IN 49.6 E SC 50.8 M IA 41.4 M SD 51.5 M KA 46.6 M TN 47.1 M KY 54.6 M TX 40.8 M LA 52.1 W UT 40.7 E ME 41.0 E VA 36.1 E MD 37.1 E VT 31.5 E MA 48.4 W WA 47.7 M MI 37.2 E WV 43.0 M MN 46.5 M WI 55.1 M MS 51.8 W WY 51.6 M MO (a) Construct a comparative boxplot that makes it possible to compare…arrow_forward
- Here are the number of legal immigrants (in thousands) who settled in each state east of the Mississippi River in a given year. Alabama 3.8 Connecticut 10.8 Delaware 2.2 Florida 102.8 Georgia 24.3 Illinois 36.0 Indiana 7.8 Kentucky 5.2 Maine 1.2 Maryland 25.5 Massachusetts 29.6 Michigan 17.0 Mississippi 1.8 New Hampshire 2.1 New Jersey 53.1 New York 133.5 North Carolina 16.8 Ohio 13.7 Pennsylvania 24.7 Rhode Island 3.3 South Carolina 4.2 Tennessee 8.5 Vermont 0.9 Virginia 27.9 West Virginia 0.8 Wisconsin 6.0 New York and Florida are high outliers in this distribution. Find the mean (in thousands) and the median (in thousands) for these data with and without New York and Florida. (Round your answers to two decimal places.) with New York and Floridaarrow_forward1. World's Richest. Each year, Forbes magazine publishes a list of the world's richest people. In 2009, the six richest people, their citizenship, and their wealth (to the nearest billion dollars) Name Citizenship Wealth ($ billion) Willlam Gate (G) Warren Buffett (B) Carlos Slim Helu (H) Lawrence Ellison (E) Karl Albrecht (A) United States 40 United States 38 Мexico 35 United States 23 Sweden 22 Ingvar Kamprad (K) Germany 22 Calculate the mean wealth, µ, of the six people. а. b. For samples of size 2, construct a table and calculate the means for samples of size 2. С. For a random sample of size 2, what is the chance that the sample mean will equal the population mean? d. For a random sample of size 2, determine the probability that the mean wealth of the two people obtained will be within 2 (i.e., $2 billion) of the population mean. Interpret your result in terms of percentages.arrow_forwardYour city wants to determine how many postal substations are needed to service its population. The city has been divided into eight postal zones. Five possible locations for the substations have been identified. Each location can service a different number of zones, as indicated in the following table. Location Zones that can be served 1,2,3 12 1,4,5 3 2,4,5,8 3,5,6,7 4 5 6,7,8 In the text box, formulate a mathematical model to determine the fewest number of substations (and their locations) needed to service all 8 postal zones. Buy "formulate," you should define decision variables, the objective function, and all appropriate constraints. You need only supply the final mathematical model (you do not need to write out the objective function or constraints in words). You will not solve this. (Hint: define inappropriate variable for each location.)arrow_forward
arrow_back_ios
SEE MORE QUESTIONS
arrow_forward_ios
Recommended textbooks for you
 MATLAB: An Introduction with ApplicationsStatisticsISBN:9781119256830Author:Amos GilatPublisher:John Wiley & Sons Inc
 Probability and Statistics for Engineering and th...StatisticsISBN:9781305251809Author:Jay L. DevorePublisher:Cengage Learning
 Statistics for The Behavioral Sciences (MindTap C...StatisticsISBN:9781305504912Author:Frederick J Gravetter, Larry B. WallnauPublisher:Cengage Learning
 Elementary Statistics: Picturing the World (7th E...StatisticsISBN:9780134683416Author:Ron Larson, Betsy FarberPublisher:PEARSON
 The Basic Practice of StatisticsStatisticsISBN:9781319042578Author:David S. Moore, William I. Notz, Michael A. FlignerPublisher:W. H. Freeman
 Introduction to the Practice of StatisticsStatisticsISBN:9781319013387Author:David S. Moore, George P. McCabe, Bruce A. CraigPublisher:W. H. Freeman
MATLAB: An Introduction with Applications
Statistics
ISBN:9781119256830
Author:Amos Gilat
Publisher:John Wiley & Sons Inc
Probability and Statistics for Engineering and th...
Statistics
ISBN:9781305251809
Author:Jay L. Devore
Publisher:Cengage Learning
Statistics for The Behavioral Sciences (MindTap C...
Statistics
ISBN:9781305504912
Author:Frederick J Gravetter, Larry B. Wallnau
Publisher:Cengage Learning
Elementary Statistics: Picturing the World (7th E...
Statistics
ISBN:9780134683416
Author:Ron Larson, Betsy Farber
Publisher:PEARSON
The Basic Practice of Statistics
Statistics
ISBN:9781319042578
Author:David S. Moore, William I. Notz, Michael A. Fligner
Publisher:W. H. Freeman
Introduction to the Practice of Statistics
Statistics
ISBN:9781319013387
Author:David S. Moore, George P. McCabe, Bruce A. Craig
Publisher:W. H. Freeman
The Shape of Data: Distributions: Crash Course Statistics #7; Author: CrashCourse;https://www.youtube.com/watch?v=bPFNxD3Yg6U;License: Standard YouTube License, CC-BY
Shape, Center, and Spread - Module 20.2 (Part 1); Author: Mrmathblog;https://www.youtube.com/watch?v=COaid7O_Gag;License: Standard YouTube License, CC-BY
Shape, Center and Spread; Author: Emily Murdock;https://www.youtube.com/watch?v=_YyW0DSCzpM;License: Standard Youtube License