
Introductory Statistics, Books a la Carte Plus NEW MyLab Statistics with Pearson eText -- Access Card Package (10th Edition)
10th Edition
ISBN: 9780134270364
Author: Neil A. Weiss
Publisher: PEARSON
expand_more
expand_more
format_list_bulleted
Videos
Textbook Question
Chapter 2.3, Problem 84E
For each data set in Exercises 2.80–2.91, use the specified grouping method to
- a. determine a frequency distribution.
- b. obtain a relative-frequency distribution.
- c. construct a frequency histogram based on your result from part (a).
- d. construct a relative-frequency histogram based on your result from part (b).
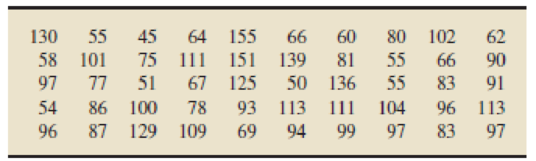
2.84 Residential Energy Consumption. The U.S. Energy Information Administration collects data on residential energy consumption and expenditures. Results are published in the document Residential Energy Consumption Survey: Consumption and Expenditures. The following table gives one year’s energy consumption for a sample of 50 households in the South. Data are in millions of BTUs. Use limit grouping with a first class of 40–49 and a class width of 10.
Expert Solution & Answer
Want to see the full answer?
Check out a sample textbook solution
Students have asked these similar questions
In Exercises 13–20, determine whether the data are from a discrete or continuous data set.
Corvettes A shift manager records the numbers of Corvettes manufactured during each day of production.
Paint lifetime: A paint company collected data on the lifetime (in years) of its paint in eleven United States cities. The data are in the following table.
Average annual
Precipitation
(inches)
48.6
43.8
29.3
26.4
City
Atlanta, GA
Boston, MA
Kansas City, KS
Minneapolis, MN
Dallas, TX
Denver, CO
Miami, FL
Phoenix, AZ
San Francisco, CA
Seattle, WA
Send data to Excel
Paint
Lifetime
Part 1 of 2
11.5
11.7
12.3
10.5
11.2
15.2
8.7
11.1
16.7
Average January
Temperature
41.9
29.6
28.4
11.2
45.0
29.5
67.1
52.3
48.5
40.6
Average July
Temperature
78.6
73.5
80.9
73.1
86,3
73.3
82.4
92.3
62.2
65.3
34.2
15.3
57.5
7.1
19.7
38.9
In Cheyenne, Wyoming, the average January temperature is 26.1, the average July temperature is 68.9, and the average annual precipitation is 13.3.
Construct a 95% confidence interval for the paint lifetime. Round your answers to at least two decimal places.
Each day, the office staff at Oasis Quick Shop prepares a frequency distribution and an ogive of sales transactions by dollar value of the
transactions. Saturday's cumulative frequency ogive follows.
The percentage of sales transactions on Saturday that were at least $100 each was
a. 100
b. 10
c. 80
d. 20
e. 15
Chapter 2 Solutions
Introductory Statistics, Books a la Carte Plus NEW MyLab Statistics with Pearson eText -- Access Card Package (10th Edition)
Ch. 2.1 - Give an example, other than those presented in...Ch. 2.1 - Explain the meaning of a. qualitative variable. b....Ch. 2.1 - Explain the meaning of a. qualitative data. b....Ch. 2.1 - Provide a reason why the classification of data is...Ch. 2.1 - Of the variables you have studied so far, which...Ch. 2.1 - For each part of Exercises 2.62.11, classify the...Ch. 2.1 - Earthquakes. The U.S. Geological Survey monitors...Ch. 2.1 - Top 10 IPOs. An online article from the Washington...Ch. 2.1 - Earnings from the Crypt. On the Celebrity NetWorth...Ch. 2.1 - World University Rankings. The Times Higher...
Ch. 2.1 - Recording Industry Statistics. The Recording...Ch. 2.1 - RBI Kings. As reported on MLB.com, the five...Ch. 2.1 - Top Broadcast Shows. As reported in Primetime...Ch. 2.1 - The Fulbright Program. The U.S. governments...Ch. 2.1 - Top 10 Green Cars. The following table presents...Ch. 2.1 - Ordinal Data. Another important type of data is...Ch. 2.2 - What is a frequency distribution of qualitative...Ch. 2.2 - Explain the difference between a. frequency and...Ch. 2.2 - Answer true or false to each of the statements in...Ch. 2.2 - In Exercises 2.202.25, we have presented some...Ch. 2.2 - Prob. 21ECh. 2.2 - In Exercises 2.202.25, we have presented some...Ch. 2.2 - Prob. 23ECh. 2.2 - In Exercises 2.202.25, we have presented some...Ch. 2.2 - In Exercises 2.202.25, we have presented some...Ch. 2.2 - For each data set in Exercises 2.262.31, a....Ch. 2.2 - For each data set in Exercises 2.262.31, a....Ch. 2.2 - For each data set in Exercises 2.262.31, a....Ch. 2.2 - For each data set in Exercises 2.262.31, a....Ch. 2.2 - For each data set in Exercises 2.262.31, a....Ch. 2.2 - For each data set in Exercises 2.262.31, a....Ch. 2.2 - In each of Exercises 2.322.37, we have presented a...Ch. 2.2 - In each of Exercises 2.322.37, we have presented a...Ch. 2.2 - In each of Exercises 2.322.37, we have presented a...Ch. 2.2 - In each of Exercises 2.322.37, we have presented a...Ch. 2.2 - In each of Exercises 2.322.37, we have presented a...Ch. 2.2 - Prob. 37ECh. 2.2 - Health Status. The National Center for Health...Ch. 2.2 - In Exercises 2.392.41, use the technology of your...Ch. 2.2 - Prob. 40ECh. 2.2 - In Exercises 2.392.41, use the technology of your...Ch. 2.3 - Identify an important reason for grouping data.Ch. 2.3 - Do the concepts of class limits, marks, cutpoints,...Ch. 2.3 - State three of the most important guidelines in...Ch. 2.3 - With regard to grouping quantitative data into...Ch. 2.3 - For quantitative data, we examined three types of...Ch. 2.3 - We used slightly different methods for determining...Ch. 2.3 - Explain the difference between a frequency...Ch. 2.3 - Explain the advantages and disadvantages of...Ch. 2.3 - For data that are grouped in classes based on more...Ch. 2.3 - Discuss the relative advantages and disadvantages...Ch. 2.3 - Suppose that you have a data set that contains a...Ch. 2.3 - Suppose that you have constructed a stem-and-leaf...Ch. 2.3 - In each of Exercises 2.542.59, we have presented a...Ch. 2.3 - In each of Exercises 2.542.59, we have presented a...Ch. 2.3 - In each of Exercises 2.542.59, we have presented a...Ch. 2.3 - In each of Exercises 2.542.59, we have presented a...Ch. 2.3 - Prob. 58ECh. 2.3 - In each of Exercises 2.542.59, we have presented a...Ch. 2.3 - Prob. 60ECh. 2.3 - Prob. 61ECh. 2.3 - In Exercises 2.602.71, we have presented some...Ch. 2.3 - In Exercises 2.602.71, we have presented some...Ch. 2.3 - In Exercises 2.602.71, we have presented some...Ch. 2.3 - In Exercises 2.602.71, we have presented some...Ch. 2.3 - Prob. 66ECh. 2.3 - In Exercises 2.602.71, we have presented some...Ch. 2.3 - In Exercises 2.602.71, we have presented some...Ch. 2.3 - Prob. 69ECh. 2.3 - In Exercises 2.602.71, we have presented some...Ch. 2.3 - In Exercises 2.602.71, we have presented some...Ch. 2.3 - Prob. 72ECh. 2.3 - In each of Exercises 2.722.75, construct a dotplot...Ch. 2.3 - Prob. 74ECh. 2.3 - In each of Exercises 2.722.75, construct a dotplot...Ch. 2.3 - In each of Exercises 2.762.79, construct a...Ch. 2.3 - Prob. 77ECh. 2.3 - In each of Exercises 2.762.79, construct a...Ch. 2.3 - Prob. 79ECh. 2.3 - Prob. 80ECh. 2.3 - For each data set in Exercises 2.802.91, use the...Ch. 2.3 - For each data set in Exercises 2.802.91, use the...Ch. 2.3 - For each data set in Exercises 2.802.91, use the...Ch. 2.3 - For each data set in Exercises 2.802.91, use the...Ch. 2.3 - For each data set in Exercises 2.802.91, use the...Ch. 2.3 - For each data set in Exercises 2.802.91, use the...Ch. 2.3 - Prob. 87ECh. 2.3 - Prob. 88ECh. 2.3 - Prob. 89ECh. 2.3 - Prob. 90ECh. 2.3 - Prob. 91ECh. 2.3 - Prob. 92ECh. 2.3 - Age of Passenger Cars. According to R. L. Polk ...Ch. 2.3 - Stressed-Out Bus Drivers. Frustrated passengers,...Ch. 2.3 - Acute Postoperative Days. Several neurosurgeons...Ch. 2.3 - MMs. In the article Sweetening StatisticsWhat MMs...Ch. 2.3 - Women in the Workforce. In an issue of Science...Ch. 2.3 - Process Capability. R. Morris and E. Watson...Ch. 2.3 - University Patents. The number of patents a...Ch. 2.3 - Prob. 100ECh. 2.3 - Prob. 101ECh. 2.3 - Adjusted Gross Incomes. The Internal Revenue...Ch. 2.3 - Cholesterol Levels. According to the National...Ch. 2.3 - Hospital Beds. The number of hospital beds...Ch. 2.3 - Parkinsons Disease. Parkinsons disease affects...Ch. 2.3 - The Great White Shark. In an article titled Great...Ch. 2.3 - The Beatles. In the article, Length of The Beatles...Ch. 2.3 - High School Completion. As reported by the U.S....Ch. 2.3 - Prob. 109ECh. 2.3 - Body Temperature. A study by researchers at the...Ch. 2.3 - Exam Scores. The exam scores for the students in...Ch. 2.3 - Prob. 112ECh. 2.3 - Prob. 113ECh. 2.3 - Age and Gender. The following bivariate data on...Ch. 2.3 - Prob. 115ECh. 2.3 - Clocking the Cheetah. Construct a...Ch. 2.3 - Prob. 117ECh. 2.3 - Residential Energy Consumption. Refer to the...Ch. 2.3 - Prob. 119ECh. 2.3 - Cardiovascular Hospitalizations. The Florida State...Ch. 2.3 - Prob. 121ECh. 2.4 - In each of Exercises 2.1222.127, explain the...Ch. 2.4 - In each of Exercises 2.1222.127, explain the...Ch. 2.4 - In each of Exercises 2.1222.127, explain the...Ch. 2.4 - Prob. 125ECh. 2.4 - Prob. 126ECh. 2.4 - Prob. 127ECh. 2.4 - Prob. 128ECh. 2.4 - Suppose that a variable of a population has a...Ch. 2.4 - Prob. 130ECh. 2.4 - Identify and sketch three distribution shapes that...Ch. 2.4 - Prob. 132ECh. 2.4 - In each of Exercises 2.1322.139, we have drawn a...Ch. 2.4 - In each of Exercises 2.1322.139, we have drawn a...Ch. 2.4 - In each of Exercises 2.1322.139, we have drawn a...Ch. 2.4 - In each of Exercises 2.1322.139, we have drawn a...Ch. 2.4 - In each of Exercises 2.1322.139, we have drawn a...Ch. 2.4 - In each of Exercises 2.1322.139, we have drawn a...Ch. 2.4 - Prob. 139ECh. 2.4 - In each of Exercises 2.1402.149, we have provided...Ch. 2.4 - In each of Exercises 2.1402.149, we have provided...Ch. 2.4 - Prob. 142ECh. 2.4 - In each of Exercises 2.1402.149, we have provided...Ch. 2.4 - In each of Exercises 2.1402.149, we have provided...Ch. 2.4 - In each of Exercises 2.1402.149, we have provided...Ch. 2.4 - In each of Exercises 2.1402.149, we have provided...Ch. 2.4 - Prob. 147ECh. 2.4 - Prob. 148ECh. 2.4 - Prob. 149ECh. 2.4 - Old Faithful. Old Faithful is a geyser in...Ch. 2.4 - SnowGoose Nests. In the article Trophic...Ch. 2.4 - Prob. 152ECh. 2.4 - In each of Exercises 2.1522.157, a. use the...Ch. 2.4 - In each of Exercises 2.1522.157, a. use the...Ch. 2.4 - Prob. 155ECh. 2.4 - In each of Exercises 2.1522.157, a. use the...Ch. 2.4 - In each of Exercises 2.1522.157, a. use the...Ch. 2.4 - Standard Normal Distribution. One of the most...Ch. 2.5 - Give one reason why constructing and reading...Ch. 2.5 - Prob. 163ECh. 2.5 - Reading Skills. Each year the director of the...Ch. 2.5 - Americas Melting Pot. The U.S. Census Bureau...Ch. 2.5 - Prob. 167ECh. 2.5 - Drunk-Driving Fatalities. Drunk-driving fatalities...Ch. 2.5 - Prob. 169ECh. 2.5 - Prob. 170ECh. 2.5 - Prob. 171ECh. 2 - This problem is about variables. a. What is a...Ch. 2 - This problem is about data. a. What are data? b....Ch. 2 - For a qualitative data set, what is a a. frequency...Ch. 2 - What is the relationship between a frequency or...Ch. 2 - Identify two main types of graphical displays that...Ch. 2 - In a bar chart, unlike in a histogram, the bars do...Ch. 2 - Some users of statistics prefer pie charts to bar...Ch. 2 - When is the use of single-value grouping...Ch. 2 - A quantitative data set has been grouped by using...Ch. 2 - A quantitative data set has been grouped by using...Ch. 2 - A quantitative data set has been grouped by using...Ch. 2 - A quantitative data set has been grouped by using...Ch. 2 - Explain the relative positioning of the bars in a...Ch. 2 - Sketch the curve corresponding to each of the...Ch. 2 - Draw a smooth curve that represents a symmetric...Ch. 2 - Prob. 16RPCh. 2 - Largest Hydroelectric Plants. According to...Ch. 2 - DVD Players. Refer to Example 2.16 on page 60. a....Ch. 2 - Inauguration Ages. From the Information Please...Ch. 2 - Inauguration Ages. Refer to Problem 19. Construct...Ch. 2 - Prob. 21RPCh. 2 - Prob. 22RPCh. 2 - Busy Bank Tellers. The Prescott National Bank has...Ch. 2 - On-Time Arrivals. The Air Travel Consumer Report...Ch. 2 - Old Ballplayers. From the ESPN Web site, we...Ch. 2 - Prob. 26RPCh. 2 - U.S. Divisions. The U.S. Census Bureau divides the...Ch. 2 - Prob. 28RPCh. 2 - Prob. 29RPCh. 2 - Hair and Eye Color. In the article Graphical...Ch. 2 - Prob. 31RPCh. 2 - In Problems 3133, a. identify the population and...Ch. 2 - In Problems 3133, a. identify the population and...Ch. 2 - UWEC UNDERGRADUATES Recall from Chapter 1 (see...Ch. 2 - Recall that, each year, Forbes magazine publishes...
Knowledge Booster


Learn more about
Need a deep-dive on the concept behind this application? Look no further. Learn more about this topic, statistics and related others by exploring similar questions and additional content below.Similar questions
- In Exercises 13–20, determine whether the data are from a discrete or continuous data set. House Attendance The Clerk of the U.S. House of Representatives records the number of representatives present at each session.arrow_forwardIn Exercises 13–20, determine whether the data are from a discrete or continuous data set. Texting Fatalities The Insurance Institute for Highway Safety collects data consisting of the numbers of motor vehicle fatalities caused by driving while texting.arrow_forward(b) Use the quadratic regression feature of a graphing calculator to get a quadratic function that approximates the data. y= ²² +t+ (Round to three decimal places as needed.)arrow_forward
- During one shift, the express lane clerk recorded how many times customers violated the "10 items or less" rule for his lane. In particular, he recorded how many items over the limit each violator placed on the conveyor belt. This data is summarized in the histogram below. NOTE: The last class actually represents "7 or more items," not just 7 items. Frequency 144 12- 10+ 8- 0.5 1.5 2.5 3.5 4.5 5.5 6.5 7.5 #items over 10 Q What is the frequency of times the limit was exceeded by at least 2 items? Answer: timesarrow_forwardUsing the data in Table 6–11, calculate a 3-month moving average forecast for month 12.arrow_forwardCalculate the relative frequency for each wear categoryarrow_forward
- ound to three decimal places as needed.) (d) Determine the probability that a randomly selected fatal crash in 2016 occurred in normal weather or in daylight. P(Normal or Daylight) = (Round to three decimal places as needed.) (e) Would it be unusual for a fatal crash in 2016 to occur while it is dark outside (without lighting) and raining? (For the purposes of this exercise, consider a probability less than 0.05 to be It be unusual for a fatal crash in 2016 to occur while it is dark outside (without lighting) and raining because the probability P(Raining and Dark without lighting) =is (Round to three decimal places as needed.) Why might this result be considered misleading? Select all that apply. A. There are likely to be fewer drivers on the road at night, especially when it is raining. B. A better question would be "Among the drivers on the road when it is dark and raining, what proportion result in a fatality?" C. Common sense indicates that a dark (without lighting) road in the…arrow_forwardBike safety 2005 The Bicycle Helmet Safety Institutewebsite includes a report on the number of bicyclefatalities per year in the United States. The table belowshows the counts for the years 1994–2005.a) What are the W’s for these data?b) Display the data in a stem-and-leaf display.c) Display the data in a timeplot.d) What is apparent in the stem-and-leaf display that ishard to see in the timeplot?e) What is apparent in the timeplot that is hard to see inthe stem-and-leaf display?f) Write a few sentences about bicycle fatalities in theUnited States.arrow_forwardThe following tables shows beef production of the six largest beef producers in the world (2016 data) Make a bar graph for these datam with the bars in descending order. Beef Producer Amount of beed (milllion metric units) United States 11.4 Bra zil 9.3 European Union 7.9 China 6.9 India 4.3 Argentina 2.6arrow_forward
- A company collects data from 10,000 websites about how long it takes to load the site. The number of seconds it takes to fully load the website is summarized in the relative frequency table. seconds to load relative frequency 1.4–1.6 0.0003 1.6–1.8 0.0012 1.8–2.0 0.0053 2.0–2.2 0.0181 2.2–2.4 0.0442 2.4–2.6 0.0910 2.6–2.8 0.1555 2.8–3.0 0.1861 3.0–3.2 0.1938 3.2–3.4 0.1447 3.4–3.6 0.0923 3.6–3.8 0.0447 3.8–4.0 0.0166 4.0–4.2 0.0048 4.2–4.4 0.0012 4.4–4.6 0.0002 The relative frequency histogram summarizes the same data. Expand Image The mean time to load a website is 3 seconds and the standard deviation is 0.4 seconds. Would a normal distribution be a good model for this distribution? Explain your reasoning. What proportion of websites loaded within 1 standard deviation of the mean? What proportion of websites loaded within 2 standard deviations of the mean? What proportion of websites loaded within 1 standard deviation of 2.8 seconds?…arrow_forwardPlease explain. I am very lost ):arrow_forwardData was collected for 300 fish from the North Atlantic. The length of the fish (in mm) is summarized in the GFDT below. Lengths (mm) Frequency 200 - 203 1 204 - 207 16 208 - 211 71 212 - 215 108 216 - 219 83 220 - 223 18 224 - 227arrow_forward
arrow_back_ios
SEE MORE QUESTIONS
arrow_forward_ios
Recommended textbooks for you
 Glencoe Algebra 1, Student Edition, 9780079039897...AlgebraISBN:9780079039897Author:CarterPublisher:McGraw Hill
 Holt Mcdougal Larson Pre-algebra: Student Edition...AlgebraISBN:9780547587776Author:HOLT MCDOUGALPublisher:HOLT MCDOUGAL
Glencoe Algebra 1, Student Edition, 9780079039897...
Algebra
ISBN:9780079039897
Author:Carter
Publisher:McGraw Hill
Holt Mcdougal Larson Pre-algebra: Student Edition...
Algebra
ISBN:9780547587776
Author:HOLT MCDOUGAL
Publisher:HOLT MCDOUGAL
How to make Frequency Distribution Table / Tally Marks and Frequency Distribution Table; Author: Reenu Math;https://www.youtube.com/watch?v=i_A6RiE8tLE;License: Standard YouTube License, CC-BY
Frequency distribution table in statistics; Author: Math and Science;https://www.youtube.com/watch?v=T7KYO76DoOE;License: Standard YouTube License, CC-BY
Frequency Distribution Table for Grouped/Continuous data | Math Dot Com; Author: Maths dotcom;https://www.youtube.com/watch?v=ErnccbXQOPY;License: Standard Youtube License