
Videos
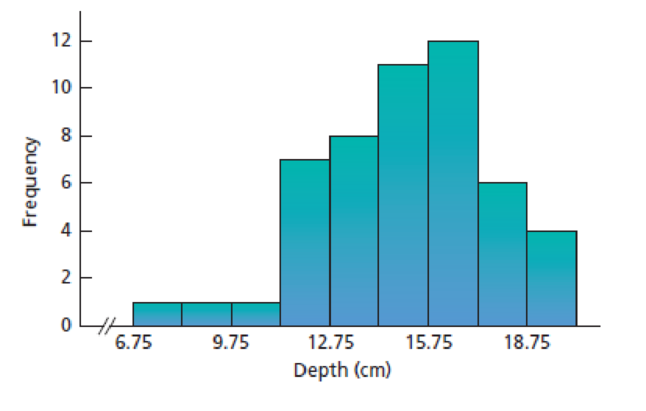
In each of Exercises 2.140–2.149, we have provided a graphical display of a data set. For each exercise, state whether the distribution is (roughly) symmetric, right skewed, or left skewed.
2.143 The Coruro’s Burrow. The subterranean coruro (Spalacopus cyanus) is a social rodent that lives in large colonies in underground burrows that can reach lengths of up to 600 meters. Zoologists S. Begall and M. Gallardo studied the characteristics of the burrow systems of the subterranean coruro in central Chile and published their findings in the Journal of Zoology, London (Vol. 251, pp. 53–60). A sample of 51 burrows, whose depths were measured in centimeters, yielded the following frequency histogram.
Want to see the full answer?
Check out a sample textbook solution
Chapter 2 Solutions
Introductory Statistics, Books a la Carte Plus NEW MyLab Statistics with Pearson eText -- Access Card Package (10th Edition)


- In a study, the effects of the mane of a male lion as a signal of quality to mates and rivals was explored. Four life-sized dummies of male lions provided a tool for testing female response to the unfamiliar lions whose manes varied by length (long or short) and color (blonde or dark). The female lions were observed to see whether they approached each of the four life-sized dummies. Complete parts (a) through (e) below. a. Identify the experimental units. Choose the correct answer below. The female lions The male dummies The mane colors The mane lengths Part 2 b. Identify the response variable. Choose the correct answer below. A. Whether or not (yes or no) the mane length affected how the female lions reacted to a male dummy. B. Whether or not (yes or no) the female lions approached the same dummies. C. Whether or not (yes or no) the female lions approached a male dummy. D. Whether or not…arrow_forwardDuring one shift, the express lane clerk recorded how many times customers violated the "10 items or less" rule for his lane. In particular, he recorded how many items over the limit each violator placed on the conveyor belt. This data is summarized in the histogram below. NOTE: The last class actually represents "7 or more items," not just 7 items. Frequency 12 10- 8 ans = 2 0.5 1.5 2.5 3.5 4.5 5.5 6.5 7.5 #items over 10 What is the frequency of times the limit was exceeded by more than 1 item?arrow_forwardDuring one shift, the express lane clerk recorded how many times customers violated the "10 items or less" rule for his lane. In particular, he recorded how many items over the limit each violator placed on the conveyor belt. This data is summarized in the histogram below. NOTE: The last class actually represents "7 or more items," not just 7 items. Frequency 14- 12 10- 8 4 2- 0.5 Answer: 1.5 2.5 3.5 4.5 5.5 #items over 10 6.5 7.5 What is the frequency of times the limit was exceeded by more than 2 items? times Qarrow_forward
- During one shift, the express lane clerk recorded how many times customers violated the "10 items or less" rule for his lane. In particular, he recorded how many items over the limit each violator placed on the conveyor belt. This data is summarized in the histogram below. NOTE: The last class actually represents "7 or more items," not just 7 items. Frequency 14 12- 10- 8 6 4 2. ans = 0.5 1.5 2.5 3.5 4.5 5.5 6.5 7.5 # items over 10 What is the frequency of times the limit was exceeded by at most 6 items? Question Help: Message instructor Add Work Submit Questionarrow_forwardDuring one shift, the express lane clerk recorded how many times customers violated the "10 items or less" rule for his lane. In particular, he recorded how many items over the limit each violator placed on the conveyor belt. This data is summarized in the histogram below. NOTE: The last class actually represents "7 or more items," not just 7 items. Frequency 12 10 8 ans = 2 0.5 1.5 2.5 3.5 4.5 5.5 6.5 7.5 #items over 10 What is the frequency of times the limit was exceeded by more than 6 items?arrow_forward2.31 The median income for a four-person family has been reported as shown here for 1993–2003. Source: Time Almanac 2006, p. 627. 1993 $45,161 1999 $59,981 1998 56,061 1994 47,012 2000 62,228 1995 49,687 2001 63,278 1996 51,518 2002 62,732 1997 53,350 2003 65,093 Construct a line graph describing these data over time.arrow_forward
- of This frequency table depicts the average hours spent on social media use for students in PSY201 class. Hours Frequency 4 3.5 3 2.5 2 1.5 1 0.5 0 10 5 5 3 7 16 0 5 3 How many students spent at least 3 hours on social media in PSY201?arrow_forwardThe amount of time adults spend watching television is closely monitored by firms because this helps to determine advertising pricing for commercials. Complete parts (a) through (d). O D. The variable "weekly time spent watching television" is likely symmetric, but not normally distributed. O E. The variable "weekly time spent watching television" is likely skewed left, not normally distributed. (b) According to a certain survey, adults spend 2.35 hours per day watching television on a weekday. Assume that the standard deviation for "time spent watching television on a weekday" is 1.93 hours. If a random sampie of 40 adults s obtained, describe the sampling distribution of x, the mean amount of time spent watching television on a weekday. V with H and o = (Round to six decimal places as needed.)arrow_forwarders each of its retail employees activates we of activations and satisfactic Activations Satisfaction O 37 8.0 22 7.9 37 8.5 37 9.0 18 6.1 27 7.0 32 8.2 28 77 Print Done ade by an employee with a job-satisfaction score of Doorsonarrow_forward
- In each graph, the shaded region represents the P-value of a hypothesis test. Find the P-value, given that the Standardized Test Statistic is T = - 1.9. Round to 4 decimals a. -4 -3 -2 -1 4 T (df.= 19) b. -2 -1 2. T (df. = 19) c. -1 1 4 T (df. = 19) Submit Question MacBook Airarrow_forwarda.State the predictors available in this model.arrow_forwardDuring one shift, the express lane clerk recorded how many times customers violated the "10 items or less" rule for his lane. In particular, he recorded how many items over the limit each violator placed on the conveyor belt. This data is summarized in the histogram below. NOTE: The last class actually represents "7 or more items," not just 7 items. Frequency SHIFT 14- 12 10- 8- 6 CAPS 0.5 1.5 2.5 3.5 4.5 5.5 5.5 6.5 7.5 #items over 10 Q What is the frequency of times the limit was exceeded by at least 2 items? 38°F Clear 4 ans 2H TAB 61 Check Answer ESC ! F1 ! Q A Z BEBEEEE F2 X 2 W S F3 # * 3 Q Search X E F4 LA 4 F5 с % R 5 LLI F6 T V 6 HCO F7 1111 4+ 7 Y F8 G H * 00 с F9 J B Narrow_forward
 Big Ideas Math A Bridge To Success Algebra 1: Stu...AlgebraISBN:9781680331141Author:HOUGHTON MIFFLIN HARCOURTPublisher:Houghton Mifflin Harcourt
 Glencoe Algebra 1, Student Edition, 9780079039897...AlgebraISBN:9780079039897Author:CarterPublisher:McGraw Hill