
Concept explainers
Videos
To review:
The relationship between the number of synonymous substitutions and the years of divergence between each pair of species, with the help of a graph. Also, estimate the rates of synonymous substitutions per million years and per generation for the complete axon on a per-site basis.
Given:
In the given study, a hypothetical gene encodes for the transcription factor in various species of Drosophila. According to the diagram (Figure 1) given below, one exon of this gene is sequenced in four species.
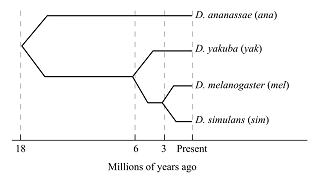
Figure 1: Million of years ago.
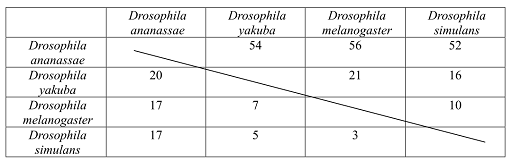
The matrix shows the number of synonymous and nonsynonymous substitutions between pairs of different Drosophila species, which evolved as a result of evolution. There are 2,000 nonsynonymous and 600 synonymous substitutions sites of the exon (Figure 2).
Figure 2: Matrix showing the number of synonymous and nonsynonymous substitutions between pairs of species of Drosophila.
Introduction:
Biologists are able to make inference about the type of natural selection, by the study based on molecular evolutionary patterns of genes. These inferences are important to know, about the gene functioning and how they evolve over the time, in response to the new function and conditions.
Explanation of Solution
According to the given analysis, there are, on an average, 54 synonymous substitutions occurs between the lineages. These lineages were diverged 18 million years ago. So, there are about 1.5 synonymous substitutions per million year for the entire exon.
Therefore, the information used for calculation of the rate is:
Time period: 18 million years ago
Substitution per million years: 1.5
Lineages: 2
Generation per year: 5
Synonymous sites: 600
Thus, for rate of substitution per generation is:
90,000,000 years
Similarly, the rate of substitution per site is:
(90,000,000 years
Graph given below shows number of substitution along with millions of years.
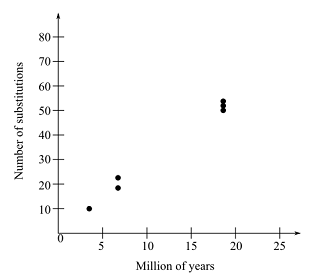
Therefore, it can be concluded that the rates are 3
Want to see more full solutions like this?
Chapter 23 Solutions
Life: The Science of Biology


- Genomics and Human Evolution The Denisovan genome contains sequences that originated from an unknown human species. Using Figure 19.11, speculate on which species this might be. Is it possible that there are other ancestral species that may remain to be discovered that would change the phylogeny presented in the figure? FIGURE 19.11 Estimates for the dates of origin and extinction for the three main groups of hominins (green, blue, and orange). The australopithecines split into two groups about 2.7 million years ago. One of those groups, the genus Homo, contains the ancestors to our species, H. sapiens.arrow_forwardImagine that you have the DNA sequences from the intron of a gene in three species called A, B, and C. Species A and B are most closely related, while C is more distantly related. The sequences of A and B differ by 18 base pairs, A and C differ by 26 base pairs, and B and C differ by 28 base pairs. Fossils show that species A and B diverged about 1.2 Mya, but there is no fossil evidence as to when the most recent common ancestor of all three species lived. (Draw a simple tree to help you think about the problem) Use the genetic data to estimate that date (most recent common ancestor). HINT = use Eqn 7.1, several times- first to estimate mutation rate. Then to estimate the unknown time since divergencearrow_forwardImagine that you have the DNA sequences from the intron of a gene in three species called A, B, and C. Species A and B are most closely related, while C is more distantly related. The sequences of A and B differ by 18 base pairs, A and C differ by 26 base pairs, and B and C differ by 28 base pairs. Fossils show that species A and B diverged about 1.2 Mya, but there is no fossil evidence as to when the most recent common ancestor of all three species lived. (Draw a simple tree to help you think about the problem) Use the genetic data to estimate that date (most recent common ancestor). What assumptions are you making to get this estimate?arrow_forward
- A 1000 nucleotide region gets sequenced from 22 dipolid individs. find the expected time to the most common ancestor that is recent.arrow_forwardMembers of two different species possess a similar-looking structure that they use in a similar way to perform about the same function. Which of the following would suggest that the relationship more likely represents homology instead of convergent evolution? a. The two species share many proteins in common, and the nucleotide sequences that code for these proteins are almost identicalb. The two species live at great distance from each otherc. The structures in adult members of both species are similar in sized. Both species are well adapted to their respective environmentsarrow_forwardIn the table below, the letters represent amino acids that make up a polypeptide found in all the vertebrates listed. Construct a cladogram from the different amino acid sequences given. Assume that the sequences are already aligned and begin with comparing the number of differences between species.arrow_forward
- The first whole-life phylogenies based on sequence data were estimated on the basis of small _______-based genes; and these phylogenies revealed that the traditional five-kingdom system of classification offers a misleading view of evolutionary relationships. A. rRNA B. miRNA C. mRNA D. tRNAarrow_forwardIn the example below, the letters represent amino acids that make up a polypeptide found in all the vertebrates listed. Use the steps outlined above to construct a cladogram from the different amino acid sequences given. Assume that the sequences are already aligned and begin with comparing the number of differences between species.arrow_forwardThere are 27 sequences from 27 individuals belonging to an unidentified group of organisms. Eleven (11) sequences were mined from NCBI while the rest are unpublished sequences from Mindanao. Sequences labeled with "SSL" are from Agusan Marsh while sequences labeled with "CKL/CITLR" and "CWL" are from Camiguin Island and Dinagat Islands respectively. Finally, sequences labeled with "MSLA" are from Mt. Magdiwata. From the nucleotide results and generated phylogenetic tree below: a) What group of organisms is represented by the phylogenetic tree? b) Identify the source (species) of each sequence. c) How many species are present in the generated tree? d) What species is considered as the outgroup? e) What genetic marker is utilized to generate the sequences? f) Which specimen group is more closely related to "SSL"? CKL or MSLA? Justify your answer h) Based on the results, what possible species name can be assigned to the MSLA group?arrow_forward
- 1. (a) The apparently constant rate of change Molecular phylogenetics Molecular evolution Molecular clock Evolutionary Signatures (b) The use of comparative genomics to infer evolutionary relationships among species Molecular phylogenetics Molecular evolution Molecular clock Evolutionary Signaturesarrow_forwardMolecular marker is used to determine relatedness of species which may directly or indirectly exerts an effect on diversity. A hypothetical ancestor has the following DNA sequences: G A A G C T A T T C A T T. There are two lineage with DNA sequences of G A A G G T A T T C T C G, and G A A C C T A T T C T G C. (1) Determine the percentage of A and T in the DNA sequence of the hypothetical ancestor. (2) Calculate the percentage of each nitrogenous base in the second lineage.arrow_forwardLet's say a 10 nucleotide DNA sequence differs by 5 nucleotides between 2 species and fossil data shows these 2 species diverged from common ancestor 25 MYA. What is the "r" (rate of substitution per site per year)? Substitution rate equation: r = K/2t• r = rate of substitution per site per year• K = number of substitutions per site• t = divergence time in millions of yearsarrow_forward
 Human Heredity: Principles and Issues (MindTap Co...BiologyISBN:9781305251052Author:Michael CummingsPublisher:Cengage Learning
 Biology: The Dynamic Science (MindTap Course List)BiologyISBN:9781305389892Author:Peter J. Russell, Paul E. Hertz, Beverly McMillanPublisher:Cengage Learning
 Human Biology (MindTap Course List)BiologyISBN:9781305112100Author:Cecie Starr, Beverly McMillanPublisher:Cengage Learning