
(a)
Interpretation:
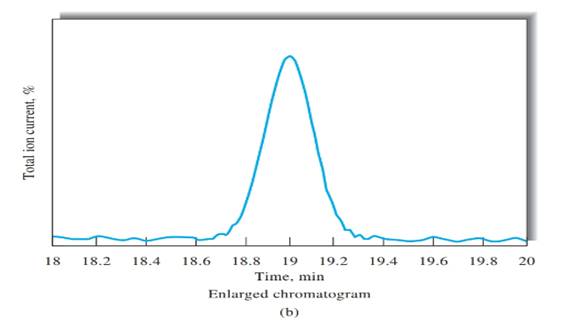
Retention time for cinnamaldehyde should be determined using Figure b.
Concept introduction:
The retention time of a substance can be determined using the chromatogram. The distance between the starting position (0) and the peak of the interested substance. From the x-axis of the chromatogram, retention time of the interested substance can be determined.
Answer to Problem 27.30QAP
Retention time = 19 min
Explanation of Solution
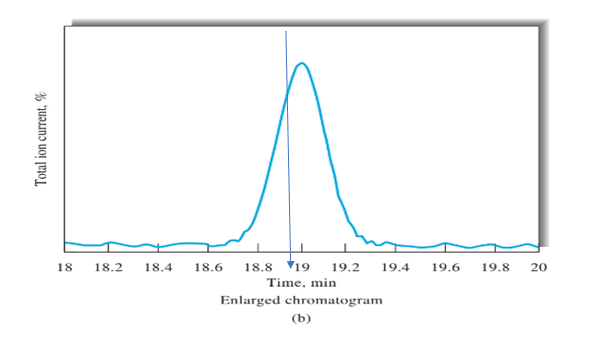
Figure b peak is obtained on the time of 19 mins, as shown using blue arrow. Therefore, retention time for cinnamaldehyde is 19 mins.
(b)
Interpretation:
Number of theoretical plates should be calculated using Figure b.
Concept introduction:
Answer to Problem 27.30QAP
N= 36,100
Explanation of Solution
Peak width, (W) should be determined first, in order to calculate the number of theoretical plates. Peak width can be determined using Figure b, indicated in black arrow.
(c)
Interpretation:
Plate height should be calculated using the information in part a and b.
Concept introduction:
Plate height can be calculated using the following equation.
Answer to Problem 27.30QAP
Plate height = 0.83 mm
Explanation of Solution
Given information:
L= 30 cm
(d)
Interpretation:
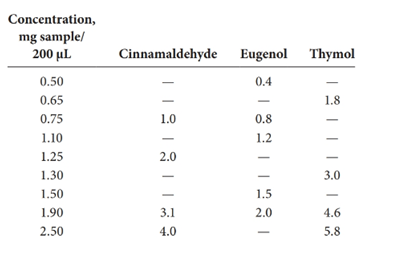
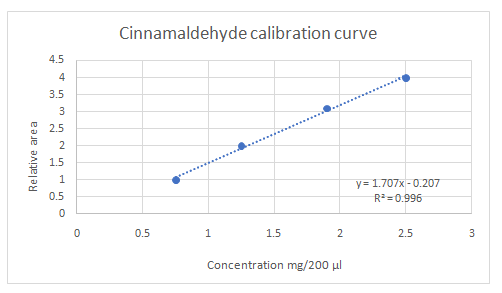
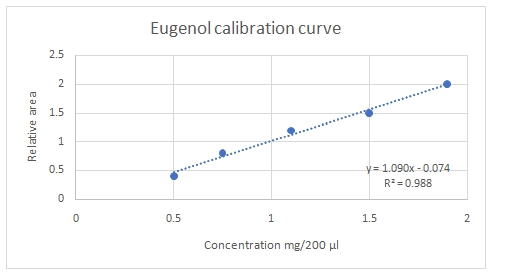
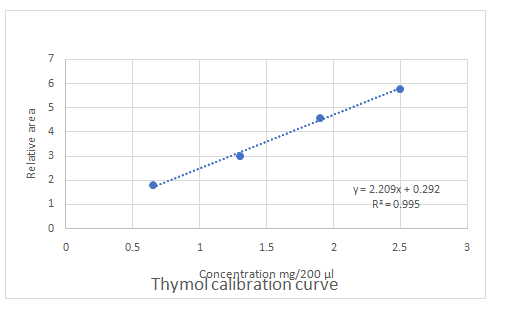
Calibration curves should be plotted for cinnamaldehyde, eugenol, and thymol. The R2 values for each compound also should be determined.
Concept introduction:
Standard addition method is an analytical method used in quantitative analysis of unknown samples. Calibration curves can be plotted, concentration vs relative peak area. That plot can be used to determine the unknown sample concentration.
Answer to Problem 27.30QAP
Explanation of Solution
Given information:
(e)
Interpretation:
Sensitivity levels of the calibration curves should be determined, as highest and lowest.
Concept introduction:
Linear regression R2 can be used to determine the linearity between two variables, with regard to this question the sensitivity of the calibration curve can be determined by the R2 value.
Answer to Problem 27.30QAP
Highest calibration curve sensitivity= Cinnamaldehyde
Lowest calibration curve sensitivity= Eugenol
Explanation of Solution
Higher the linear regression, higher the sensitivity of calibration curve. Linear regression R2 can be used to determine the linearity between two variables. Statistically, higher linear regression represents higher linearity/fitting of two variables to a linear equation.
Therefore, in this case cinnamaldehyde has the highest sensitivity, while eugenol has the lowest sensitivity.
(f)
Interpretation:
Concentrations of each component in the sample should be calculated. Then the standard deviation also should be calculated.
Concept introduction:
The equation obtained from the calibration curve in part d can be used in the calculation of concentrations of unknown samples.
Answer to Problem 27.30QAP
Standard deviations of:
Cinnamaldehyde=1.130
Eugenol=0.564
Thymol= 1.523
Explanation of Solution
Given information:
Information provided in the question that is used to solve this particular category
Relative peak areas:
Cinnamaldehyde=2.6
Eugenol=0.9
Thymol=3.8
Detailed explanation/work out of the complete problem.
Standard deviations were calculated using Excel sheets.
(g)
Interpretation:
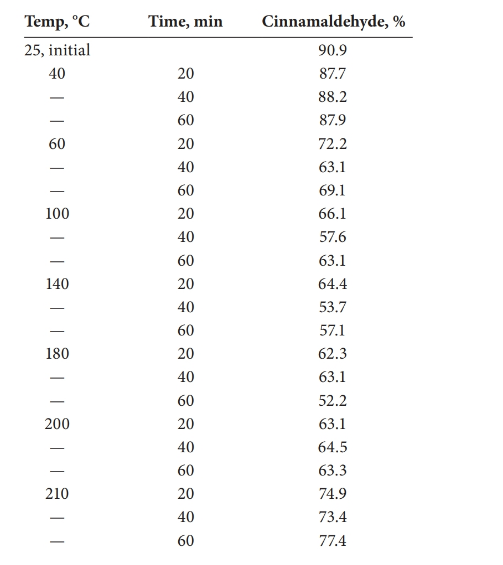
The statistical effect should be calculated for the decomposition of cinnamaldehyde with the temperature.
Concept introduction:
Analysis of variance (ANOVA) test can be done in order to determine whether there is a statistical effect on temperature for the decomposition of cinnamaldehyde.
Answer to Problem 27.30QAP
There is a statistical effect on the decomposition of cinnamaldehyde.
Explanation of Solution
Given information:
Detailed explanation/work out of the complete problem.
The test was carried out using Excel.
| Anova: Single Factor | ||||||
| SUMMARY | ||||||
| Groups | Count | Sum | Average | Variance | ||
| Column 1 | 7 | 930 | 132.8571 | 4623.81 | ||
| Column 2 | 7 | 490.7 | 70.1 | 82.59 | ||
| ANOVA | ||||||
| Source of Variation | SS | df | MS | F | P-value | F crit |
| Between Groups | 13784.61 | 1 | 13784.61 | 5.857814 | 0.0323 | 4.747225 |
| Within Groups | 28238.4 | 12 | 2353.2 | |||
| Total | 42023 | 13 | ||||
| Anova: Two-Factor Without Replication | ||||||
| SUMMARY | Count | Sum | Average | Variance | ||
| 20 | 7 | 490.7 | 70.1 | 82.59 | ||
| 40 | 7 | 463.6 | 66.22857 | 131.359 | ||
| 60 | 7 | 470.1 | 67.15714 | 149.1929 | ||
| 40 | 3 | 263.8 | 87.93333 | 0.063333 | ||
| 60 | 3 | 204.4 | 68.13333 | 21.40333 | ||
| 100 | 3 | 186.8 | 62.26667 | 18.58333 | ||
| 140 | 3 | 175.2 | 58.4 | 29.89 | ||
| 180 | 3 | 177.6 | 59.2 | 36.91 | ||
| 200 | 3 | 190.9 | 63.63333 | 0.573333 | ||
| 210 | 3 | 225.7 | 75.23333 | 4.083333 | ||
| ANOVA | ||||||
| Source of Variation | SS | df | MS | F | P-value | F crit |
| Rows | 57.19143 | 2 | 28.59571 | 2.06938 | 0.168992 | 3.885294 |
| Columns | 2013.03 | 6 | 335.5049 | 24.27942 | 4.75E-06 | 2.99612 |
| Error | 165.8219 | 12 | 13.81849 | |||
| Total | 2236.043 | 20 | ||||
(h)
Interpretation:
The test should be carried out to the hypothesis that, there is no effect of temperature or time on the decomposition of the sample.
Concept introduction:
Statistical test ANOVA should be carried out in order to check the hypothesis.
Answer to Problem 27.30QAP
Check the explanation part.
Explanation of Solution
| Anova: Two-Factor Without Replication | ||||||
| SUMMARY | Count | Sum | Average | Variance | ||
| 20 | 6 | 403 | 67.16667 | 26.83067 | ||
| 40 | 6 | 375.4 | 62.56667 | 44.99067 | ||
| 60 | 6 | 382.2 | 63.7 | 78.636 | ||
| 60 | 3 | 204.4 | 68.13333 | 21.40333 | ||
| 100 | 3 | 186.8 | 62.26667 | 18.58333 | ||
| 140 | 3 | 175.2 | 58.4 | 29.89 | ||
| 180 | 3 | 177.6 | 59.2 | 36.91 | ||
| 200 | 3 | 190.9 | 63.63333 | 0.573333 | ||
| 210 | 3 | 225.7 | 75.23333 | 4.083333 | ||
| ANOVA | ||||||
| Source of Variation | SS | df | MS | F | P-value | F crit |
| Rows | 68.92444 | 2 | 34.46222 | 2.238356 | 0.157272 | 4.102821 |
| Columns | 598.3244 | 5 | 119.6649 | 7.772354 | 0.003183 | 3.325835 |
| Error | 153.9622 | 10 | 15.39622 | |||
| Total | 821.2111 | 17 | ||||
Want to see more full solutions like this?
Chapter 27 Solutions
Principles of Instrumental Analysis

- Below are responses generated using the isolated guinea-pig ileum preparation to determine a pA2 value for the cholinergic antagonist homatropine.Responses are expressed in millimetres +/- SDM (n = 4).1. Plot the data on a sheet of paper and then determine by Schild analysis the pA2 value and Schild slope 2. show all calculation on a table form on a sheet of paper 3. discuss the result with conclusionarrow_forwardBelow are responses generated using the isolated guinea-pig ileum preparation to determine a pA2 value for the cholinergic antagonist homatropine.Responses are expressed in millimetres +/- SDM (n = 4).Plot two data graph on a sheet or excell and then determine by Schild analysis the pA2 value and Schild slope. show calculationsWhat conclusions can you draw; does the experiment/data fulfil the criteria for a valid Schild analysis?arrow_forwardBelow are responses generated using the isolated guinea-pig ileum preparation to determine a pA2 value for the cholinergic antagonist homatropine.Responses are expressed in millimetres +/- SDM (n = 4).1. Plot the data on excel and then determine by Schild analysis the pA2 value and Schild slope 2. show all calculation on a sheet of paper 3. discuss the result with conclusionarrow_forward
- Asparagine and glutamine residues in proteins are deamidated in an aqueous solution to yield aspartate and glutamate, respectively, and ammonium. Proteins undergoing deamidation of one or more of their Asn or Gln groups have been detected by isoelectric focusing. Why would isoelectric focusing be effective in separating deamidated from non-deamidated protein? Compare the relative pI values of the deamidated and non-deamidated proteins.arrow_forwardIn order to improve the peptide separation by using a HPLC system, trifluoroacetic acid acts as mobile-phase modifier was added during the preparation of mobile phase. The preparation was performed by a postgraduate student as following:“2.851 g trifluoroacetic acid (MW: 114.02 g/mol) was made up to 500 cm3 in a graduated flask. To this solution, 50 cm3 of ethanol was added, and after mixing the mobile phase was placed in the solvent reservoir and pumping was commenced at 1.5 cm3 min-1.”Based on the given preparation procedure, identify THREE mistakes that were made.arrow_forwardGive advantages of Ziegler–Natta catalysts ?arrow_forward
- For an enzyme-catalyzed reaction, the presence of 10 nM of a reversible inhibitor yields a Vmax value that is 80% of the value in the absence of the inhibitor. The KM is unchanged by the inhibitor. (a) What type of inhibition is taking place? (b) Calculate the dissociation constant for the inhibitor (Ki). (c) What percentage of the enzyme molecules have bound inhibitor?arrow_forwardIf inhibitor X changes lactase activity to a Vo of 0.10 mM per minute when [S] = 1.0 mM, and a Vo of 0.133333333333 mM per minute when [S] = 2.0 mM, calculate the new Vmax. Calculate the new Km of the above lactase reaction, with inhibitor X. Calculate the slope on a Lineweaver-Burk plot (Km / Vmax) for the lactase reaction with inhibitor X. Inhibitor X exerts which of the following effects on the above enzyme (lactase)?arrow_forwardAll methyl esters of long-chain aliphatic acids (e.g., methyl tetradecanoate, C13H27COOCH3) show significant fragment ions at m/z 74, 59, and 31. What are the structures of these ions? How are they formed?arrow_forward
- Give a clear handwritten answer??asaparrow_forwardOne common way to determine phosphorous in urine is to treat the sample after removing the protein with molybdenum (VI) and then reducing the resulting 12-molybdophosphate complex with ascorbic acid to give an intense blue-coloured species called molybdenum blue. The absorbance of molybdenum blue can be measured at 650 nm. A 24-hour urine sample was collected, and the patient produced 1122 mL in 24 hours. A 1.00 mL aliquot of the sample was treated with Mo (VI) and ascorbic acid and diluted to a volume of 50.00 mL A calibration curve was prepared by treating 1.00 mL aliquot of phosphate standard solution in the same manner as the urine sample. The absorbances of the standards and the urine sample were obtained at 650 nm and the following results were obtained. ppm, P aBSORBANCE (A) 1.003.00 0.230 2.00 0.436 3.00 0.638 4.00 0.848 Urine sample 0.518 ffind the slope and intercept, then graph it.arrow_forwardBetnovate-RD® contains 0.025% w/w betamethasone valerate in a water-miscible basis. How much betamethasone valerate is contained in a 100g tube?arrow_forward
 Principles of Instrumental AnalysisChemistryISBN:9781305577213Author:Douglas A. Skoog, F. James Holler, Stanley R. CrouchPublisher:Cengage Learning