
Videos
Radiology
Mobile displays have the potential to increase the flexibility of consulting radiologists if they can be shown to be comparable to traditional display modalities. A study was performed comparing a mobile display iPad 2 with a larger liquid crystal display (LCD) for the diagnosis of tuberculosis (TB) on chest radiography (Abboud et al., [19]). De-identified images of 240 chest X-rays were transferred from a PACS workstation (LCD) to an iPad 2 tablet. The images were reviewed independently by 5 radiologists and were graded as positive or negative for TB on both the LCD and the iPad 2. The reviews occurred at different times to avoid recall bias.
A database of > 500 chest X-rays was created from TB screening films over a 4-month period. Of these, 200 cases originally interpreted as TB-negative and 40 cases originally interpreted as TB-positive were selected at random for study. The images were re-reviewed using both an LCD and an iPad 2 imaging display, albeit at different times. The results were as shown in Table 3.21.
Table 3.21 Comparison of TB screening results using an LCD and iPad 2 display
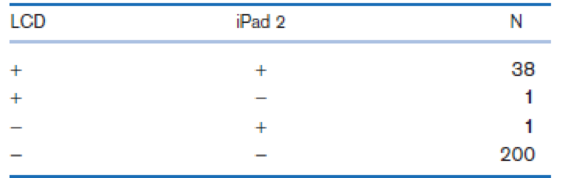
The selection of images for this study was enriched to increase the number of images originally interpreted as positive. Suppose the underlying percentage of positive TB tests is 10% in a large sample of chest X-rays assessed by LCD.
If a subject tests positive on an iPad 2 display, then what is the
Want to see the full answer?
Check out a sample textbook solution
Chapter 3 Solutions
EBK FUNDAMENTALS OF BIOSTATISTICS


- Using satellite imagery to aid agriculture grain production has been done on a limited scale as far back as the 1970's when NASA first launched the Landsat satellite. But it has only been recently that the satellite images, including GPS satellites, and data from typical farm operations have been integrated together to provide a data driven innovative technology that improves the efficiency and productivity on farms. In one study samples were taken on wheat yields in the State of Washington which historically had average yields of 35.6 bushels per acre with a standard deviation of 3.7 bushels per acre. Suppose that a random sample of the wheat yields on 40 different farms was taken and the sample mean for the wheat yields was computed, and you are interested in a probability about the sample mean. 28. Pick the equation most appropriate to deal with the problem above. a) p(x) = (nCx) p*(1-P)"-* b) x = μ + zo c) z= x-μ of √n d) z = x-μ O 29. If the sample mean is 34.8 bushels of wheat,…arrow_forwardA survey of high school students was done to examine whether students had ever driven a car after consuming a substantial amount of alcohol (1=yes, 0=no). Data was collected on their sex (male/female), race (White/non-White), and grade level (9,10,11,12). Researchers realized that the impact of race on consuming alcohol before driving might vary by grade level and decided to fit the following model. Variable Coding = 1 if Intercept Sex () Female Race () Black Grade level ( 9th grade 10th grade 11th grade [Reference = 12th grade] Attached is the logistic model 1. Compute the OR of drinking before driving for students who self-reported as Black versus non-Black in the 9th grade, adjusting for gender. 2. Compute the OR of drinking before driving for students who self-reported as Black versus non-Black in the 12th grade, adjusting for gender. 3. Compute the OR of drinking before driving for someone in the 9th grade versus 12th grade for a student who…arrow_forwardThe data for lab 1-2 was created based upon the paper by the STARSproject and modified by Dr. Hole. Fast food meals are typically high incalories, fat, sodium and cholesterol, which are known to increase the riskof obesity and diabetes. Researchers found that unhealthy ingredients,large portion size, low cost, and convenience make fast food cause obesity.The dataset provided by Dr. Hole is derived from a very large consumersurvey conducted by market researchers at Milward Brown. The survey wascarried out using a CATI (computer Aided Telephone Interviewing)methodology. Random digit telephone numbers were dialed and theperson answering was asked “Do you buy fast food nowadays?” Only thoseresponding “Yes” were then surveyed. In class, we already examined thedatasets, found results, and drew tables to answer several questions.Dataset: Lab 1-2.savRequirements: For your 1-2 assignment, please provide scholarly tables and your findings/thoughts with reasonable justification for the following…arrow_forward
- PLEASE DON'T UPLOAD A PICTURE OF THE ANSWER. PLEASE TYPE IT SO I CAN COPY AND PASTE IT INTO MY NOTES. THANK YOU!! Chi-Square Good of Fit Problem: Automobile insurance is much more expensive for teenage drivers than for older drivers. To justify this cost difference, insurance companies claim that the younger drivers are much more likely to be involved in costly accidents. To test this claim, a researcher obtained information about registered drivers from the Department of Motor Vehicles (DMV) and selected a sample of n = 300 accidents reports from the police department. The DMV reports the percentage of registered drivers in each age category as follows: 16% are younger than age 20,; 28%are 20 to 29 years old;and 56% are age 30 and older. The number of accidents reports for each age group is as follows: Under age 20 Age 20-29 Age 30 and older 68 92 140 Is…arrow_forwardA study is conducted to determine the relationship between study hours and exam scores, what is the dependent variable in this scenario?arrow_forwardErnesto is a web developer who is looking to determine which of two types of advertisements are the most cost effective. He suspects that advertisements with animations generate more clicks than advertisements without animations but wants to confirm his intuition before he starts recommending advertisements with animations to his clients. Ernesto creates advertisements with animations for 12 different products and then creates advertisements without animations for those same products. Then he measures the click-through rate for those advertisements. The data are provided below (given as percentages of total visitors to the site who clicked on the advertisement). Assume that the conditions required for this hypothesis test are satisfied. Use a calculator to test the paired data, where α=0.01. Compute the sample differences d using d=Without−With. Which of the following statements are accurate for this hypothesis test in order to evaluate the claim that the true mean difference between…arrow_forward
- use calculator methodarrow_forwardNorthern flying squirrels eat lichen and fungi, which makes for a relatively low quality diet. The authors of the paper "Nutritional Value and Diet Preference of Arboreal Lichens and Hypogeous Fungi for Small Mammals in the Rocky Mountains" + measured nitrogen intake and nitrogen retention in six flying squirrels that were fed the fungus Rhizopogon. Data read from a graph that appeared in the paper are given in the table below. (The negative value for nitrogen retention for the first squirrel represents a net loss in nitrogen.) Nitrogen Intake, x (grams) 0.03 0.10 0.07 0.06 0.07 0.25 (a) Construct a scatterplot of these data. y 0.10 0.05 -0.05 y 0.10 0.05 -0.05 0.05 0.10 g 0.05 0.10 Nitrogen Retention, y (grams) -0.04 0.00 0.01 0.01 0.04 0.11 g + 0.15 0.20 0.25 0.15 ●● 0.20 0.25 X y 0.10 0.05 -0.05 y 0.10 0.05 -0.05 (b) Find the equation of the least-squares regression line. (Round your values to five decimal places.) ŷ = 0.05 0.10 0.15 0.20 0.25 0.05 0.10 0.15 0.20 0.25 (c) Based on…arrow_forwardTwo of the hottest smartphones on the market are the newly released iPhone6 and the Samsung Galaxy S6. CNet.com offers online reviews of all major cell phones, including battery life tests. In a review of the iPhone6, the talk-time battery life of 35 iPhones was measured. Similarly, the talk-time battery life of 30 Galaxy S6s was measured. Two outputs are given below. Which is appropriate for analyzing the data collected? Output 1 Output 2 Using the StatCrunch output chosen above, determine if there is a difference in the mean battery life for the two phones. Use a significance level of 0.01 when conducting the test. Select the appropriate hypotheses. Make sure the notation used in the hypotheses agrees with the type of samples selected in the output. Ho:μd=0Ho:μd=0Ha:μd<0Ha:μd<0 Ho:μd=0Ho:μd=0Ha:μd≠0Ha:μd≠0 Ho:μd=0Ho:μd=0Ha:μd>0Ha:μd>0 Ho:μ1=μ2Ho:μ1=μ2Ha:μ1>μ2Ha:μ1>μ2 Ho:μ1=μ2Ho:μ1=μ2Ha:μ1≠μ2Ha:μ1≠μ2 Ho:μ1=μ2Ho:μ1=μ2Ha:μ1<μ2Ha:μ1<μ2 αα =…arrow_forward
- A survey of high school students was done to examine whether students had ever driven a car after consuming a substantial amount of alcohol (1=yes, 0=no). Data was collected on their sex (male/female), race (White/non-White), and grade level (9,10,11,12). Researchers realized that the impact of race on consuming alcohol before driving might vary by grade level and decided to fit the following model. Compute the OR of drinking before driving for students who self-reported as Black versus non-Black in the 9th grade, adjusting for gender. Hello, thank you for helping me out with this. I'm just confused about the concept of adjusting for gender in this case. I am not sure if I should plug in 0 and 1 for the gender and report those out separately or if I should take both odds ratios and divide them?arrow_forwardSince muscle tension in the head region has been associated with tension headaches, a researcher reasoned that if the muscle tension could be changed, perhaps the headaches would also be changed. The researcher designed an experiment in which nine subjects with tension headaches participated. The subjects kept daily logs of the number of headaches they experienced during a 2-week baseline period. Then the researcher trained them to change their muscle tension in the head region, using a biofeedback device. For this experiment, the biofeedback device was connected to a muscle in the forehead region. The device indicated the subject's amount of tension in the muscle to which it was attached and helped them achieve low tension levels. After 6 weeks of training, during which the subjects became successful at maintaining low muscle tension, they again kept a 2-week log of the number of headaches experienced. The following are the number of headaches recorded during each 2-week period.…arrow_forwardFoot ulcers are a common problem for people with diabetes. Higher skin temperatures on the foot indicate an increased risk of ulcers. The article "An Intelligent Insole for Diabetic Patients with the Loss of Protective Sensation" (Kimberly Anderson, M.S. Thesis, Colorado School of Mines), reports measurements of temperatures, in °F, of both feet for 181 diabetic patients. The results are presented in the following table. Left Foot Right Foot 80 80 85 85 75 80 88 86 89 87 87 82 78 78 88 89 89 90 76 81 89 86 87 82 78 78 80 81 87 82 86 85 76 80 88 89 Construct a scatterplot of the right foot temperature (y) versus the left foot temperature (x). Verify that a linear model is appropriate. b. Compute the least-squares line for predicting the right foot temperature from the left foot temperature. If the left foot temperatures of two patients differ by 2 degrees, by how much would you predict their right foot temperatures to differ? Predict the right foot temperature for a patient whose left…arrow_forward
 Linear Algebra: A Modern IntroductionAlgebraISBN:9781285463247Author:David PoolePublisher:Cengage Learning
 Big Ideas Math A Bridge To Success Algebra 1: Stu...AlgebraISBN:9781680331141Author:HOUGHTON MIFFLIN HARCOURTPublisher:Houghton Mifflin Harcourt