
Concept explainers
Videos
Laboratory measures of cardiovascular reactivity are receiving increasing attention. Much of the expanded interest is based on the belief that these measures, obtained under challenge from physical and psychological stressors, may yield a more biologically meaningful index of cardiovascular
TABLE 3.11 Classification of cardiovascular reactivity using an automated and a manual sphygmomanometer
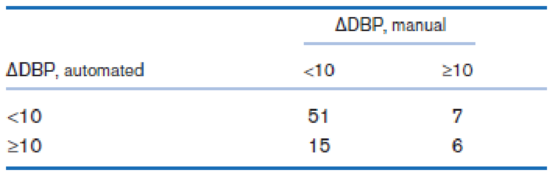
If the population tested is representative of the general population, then what are the PV+ and PV− using this test?

Trending nowThis is a popular solution!

Chapter 3 Solutions
EBK FUNDAMENTALS OF BIOSTATISTICS


- What does the y -intercept on the graph of a logistic equation correspond to for a population modeled by that equation?arrow_forwardUrban Travel Times Population of cities and driving times are related, as shown in the accompanying table, which shows the 1960 population N, in thousands, for several cities, together with the average time T, in minutes, sent by residents driving to work. City Population N Driving time T Los Angeles 6489 16.8 Pittsburgh 1804 12.6 Washington 1808 14.3 Hutchinson 38 6.1 Nashville 347 10.8 Tallahassee 48 7.3 An analysis of these data, along with data from 17 other cities in the United States and Canada, led to a power model of average driving time as a function of population. a Construct a power model of driving time in minutes as a function of population measured in thousands b Is average driving time in Pittsburgh more or less than would be expected from its population? c If you wish to move to a smaller city to reduce your average driving time to work by 25, how much smaller should the city be?arrow_forwardFind the equation of the regression line for the following data set. x 1 2 3 y 0 3 4arrow_forward
- A biologist wished to study the effects of ethanol on sleep time. A sample of 80 rats, matched for age and other characteristics, was selected, and each rat was given an oral injection having a particular concentration of ethanol per body weight. The rapid eye movement (REM) sleep time for each rat was then recorded for a 24-hour period. The results are summarized in the side-by-side boxplots below. (a) How is the amount of ethanol given related to the median REM sleep time? Explain.(b) Does the amount of ethanol given affect the variability of REM sleep time? Explain.(c) What amount of ethanol given leads to the most skewed distribution of sleep times?(d) Is the distribution of REM sleep times for the rats given 2 g/kg ethanol symmetric, skewed left,or skewed right?arrow_forwardWinter visitors are extremely important to the economy of Southwest Florida. Hotel occupancy is an often- reported measure of visitor volume and visitor activity. Hotel occupancy data for February in two consecutive years are as follows. Current Year Previous Year Оссирied Rexms 1470 1458 Total Rooms 1750 1800 a. Formulate the hypothesis test that can be used to determine if there has been an increase in the proportion of rooms occupied over the one-year period. b. What is the estimated proportion of hotel rooms occupied each year? Using a 0.05 level of significance, what is your hypothesis test conclusion? What is the p-value? C. d. What is the 95% confidence interval estimate of the change in occupancy for the one-year period?arrow_forwardAs a good experimenter, you have built a predictive model of the experimental data. The differences between the actual response data and the model data are termed: A. Confounded data B. Nested experiments C. Residuals D. Efficiency of estimatorsarrow_forward
- Distress in EMSworkers. The Journal consulting and Clinical Psychology reported on a study of emergency service (EMS) rescue workers who responded to the I-880 freeway collapse during a San Francisco earthquake. The goal of the study was to identify the predictors of symptomatic distress in the EMS workers. One of the distress variables studied was the Global Symptom Index (GSI). Several models for GSI, y, were considered based on the following independent variables: x1 = Critical Incident Exposure scale (CIE) x2 = Hogan Personality Inventory—Adjustment scale (HPI-A) x3 = Years of experience (EXP) x4 = Locus of Control scale (LOC) x5 = Social Support scale (SS) x6 = Dissociative Experiences scale (DES) x7 = Peritraumatic Dissociation Experiences Questionnaire, self-report (PDEQ-SR) (a) Write a first-order model for E(y) as a function of the first five independent variables, x1 –x5. (b) The model of part a, fitted to data collected for n = 147 EMS workers, yielded the following results:…arrow_forwardPart Barrow_forwardAccording to the World Health Organization, obesity has reached epidemic proportions globally. While obesity has generally been linked with chronic disease and disability, researchers argue that it may also affect wages. In other words, the body mass index (BMI) of an employee is a predictor for salary. (A person is considered overweight if his/her BMI is at least 25 and obese if BMI exceeds 30.) The accompanying data file includes salary (in $1,000s) for 30 college-educated men with their respective BMI and a dummy variable that represents 1 for a white man and 0 otherwise. Salary BMI White 34 33 1 43 26 1 44 26 1 34 35 0 34 36 1 53 20 1 42 20 0 37 26 1 35 28 1 46 22 1 46 20 1 34 35 0 45 26 1 33 34 0 25 29 0 32 30 1 46 18 0 31 31 0 54 19 1 37 23 0 42 27 1 38 30 1 45 18 0 38 26 0 41 28 1 39 28 1 50 20 1 41 26 1 38 28 1 45 21 1 1. Estimate a model for Salary with BMI and White as the predictor variables. Note: Negative…arrow_forward
- A survey of consumers who had recently purchased their first smartphones sought to identify how much these consumers knew about using smartphone technology. The findings were as follows: 90% could connect to the Internet, 80% could download an app, 55% could use Bluetooth, 44% had set up their phones to receive e-mail, and 5% knew only how to make and receive voice calls and texts. Present this data graphically.arrow_forwardPlease answer the questionarrow_forwardAccording to the CDC, cholesterol levels can be reduced by following a healthy diet, getting regular exercise, and reducing the amount of alcohol consumed on a weekly basis. One method of monitoring overall cholesterol levels is to calculate your cholesterol ratio (LDL/HDL), in general a cholesterol ratio between 3.5 and 5.0 is considered to be healthy for most adults. Suppose you are a clinical researcher testing the effects of these lifestyle changes on patient cholesterol levels. In order to determine if following these guidelines helps to reduce overall cholesterol, a total of 18 participants (N = 18) with moderate to high cholesterol ratios (i.e., 3.91 to > 5.0) were recruited for a healthy lifestyle study and their cholesterol ratio was calculated three times over a six week period: Week 0 (baseline), Week 3, and Week 6. Using the variables "Week 0", "Week 3", and "Week 6" in the data set, conduct a One-Way, Within Subjects (AKA Repeated Measures) ANOVA, at α = 0.05, to see…arrow_forward
 Functions and Change: A Modeling Approach to Coll...AlgebraISBN:9781337111348Author:Bruce Crauder, Benny Evans, Alan NoellPublisher:Cengage Learning
 Glencoe Algebra 1, Student Edition, 9780079039897...AlgebraISBN:9780079039897Author:CarterPublisher:McGraw Hill
 Big Ideas Math A Bridge To Success Algebra 1: Stu...AlgebraISBN:9781680331141Author:HOUGHTON MIFFLIN HARCOURTPublisher:Houghton Mifflin Harcourt