
Videos
Precise quantification of smoking during pregnancy is difficult in retrospective studies. Routinely collected blood specimens from newborns for screening purposes may provide a low-cost method to objectively measure maternal smoking close to the time of delivery. Serum cotinine is an important biomarker of recent smoking. A study was performed comparing cotinine levels in dried blood spots in newborns with those in umbilical cord blood (the gold standard) among 428 newborns in the California Genetic Screening Program (Yang et al. [11]). The lowest detection limit for dried blood spot cotinine was 3.1 ng/mL. The data in Table 3.9 were presented relating dried blood spot cotinine determinations to umbilical cord blood cotinine determinations.
Suppose a cutoff of ≥ 5 ng/mL is proposed as a criterion for testing positive based on dried blood spot cotinine levels.
TABLE 3.9 Distribution of Cotinine Level in Dried Blood Spots from Newborns by Maternal Active Smoking Status* close to the time of delivery among 428 babies delivered in California, 2001–2003
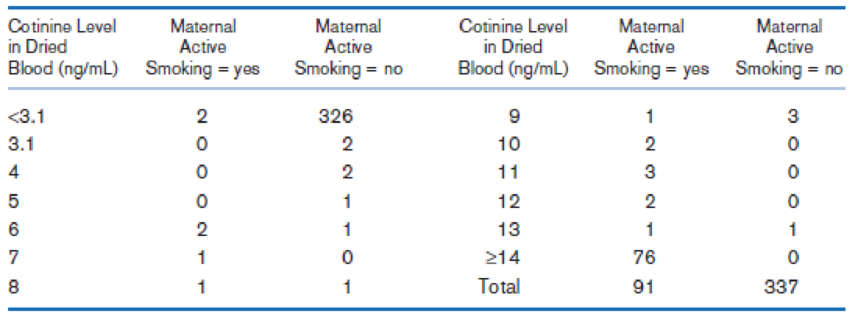
*Maternal active smoking at the time of delivery was defined as cord blood levels of ≥10 ng/mL.
Suppose it is estimated based on a large sample of births in California that 20% of mothers smoke at the time of delivery.
Suppose the screening test for detecting whether a mother smokes at the time of pregnancy is based on a cutoff of ≥ 5 ng/mL using dried blood specimens from the newborn.
What is the
Want to see the full answer?
Check out a sample textbook solution
Chapter 3 Solutions
EBK FUNDAMENTALS OF BIOSTATISTICS


- What is meant by the sample space of an experiment?arrow_forwardDoes statistically different indicate substantially different? Why or why not?arrow_forwardAccording to a CCH Unscheduled Absence survey, 9% of small businesses use telecommuting of workers in an effort to reduce unscheduled absenteeism. This proportion compares to 6% for all businesses. Is there really a significant difference between small businesses and all businesses on this issue? Use these data and an alpha of .10 to test this question. Assume that there were 725 small businesses and 875 other businesses in this survey. Appendix A Statistical Tables (Round the intermediate values to 4 decimal places. Round your answer to 2 decimal places.) Observed z = %3D The decision is toarrow_forward
- 1) Soda consumption is very common in the U.S. For the purposes of this question, assume that 30% of the population consumes the equivalent of 3 or more 12 oz. sodas per week (this is the prevalence of the exposure). A large multi-center cohort study was conducted to evaluate the association between soda consumption and risk of diabetes. At baseline, participants were asked about their typical soda consumption, and individuals who reported consuming 3 or more sodas per week were considered exposed. Participants were followed for 10 years, and the following results were obtained: Incident Cases of Diabetes 356 236 Person-Years Contributed 3+ sodas a week 375234 <3 sodas a week 399763 a) Name the appropriate measure of association corresponding to the excess rate of diabetes attributable to soda consumption among subjects who consume 3+ sodas per week. Calculate this measure (shown as a rate, using the correct units), and provide a brief interpretation of your answer b) Calculate the…arrow_forward1) Soda consumption is very common in the U.S. For the purposes of this question, assume that 30% of the population consumes the equivalent of 3 or more 12 oz. sodas per week (this is the prevalence of the exposure). A large multi-center cohort study was conducted to evaluate the association between soda consumption and risk of diabetes. At baseline, participants were asked about their typical soda consumption, and individuals who reported consuming 3 or more sodas per week were considered exposed. Participants were followed for 10 years, and the following results were obtained: Incident Cases of Diabetes 356 236 Person-Years Contributed <3 sodas/wk: 3+ sodas a week <3 sodas a week a) Was this a prospective study or a retrospective study, and was it a general cohort or a specific exposure cohort? 375234 399763 b) Name the appropriate measure of disease (morbidity) frequency and calculate this measure for each group 3+ sodas/wk: c) Name the appropriate relative measure of association…arrow_forwardDid the authors note any differences in gender with regard to fish consumption and inflammatory markers? What does this result mean? When compared with the non-fish consumers, those who consumed >300 g of fish per week had on average ____% lower CRP. Was this result significant? How do you know? What was the value of Amyloid A (mg/dl) for the group that made up the largest percentage of the sample? How much fish did this group consume? Do the study findings have implications for health care? If so what are they? Provide a rationale for your answer.arrow_forward
- This question refers to excavations at a national monument. One question the archaeologists asked was: Is raw material used by prehistoric Indians for stone tool manufacture independent of the archaeological excavation site? Two different excavation sites gave the information in the following table. Use a chi-square test with 5% level of significance to test the claim that raw material used for construction of stone tools and excavation site are independent.arrow_forwardAn SMR over 100% ( i.e.,171 %) indicates that the "healthy worker effect" may be an issue in the interpretation of data from this study population. O True O Falsearrow_forwardPassive exposure to environmental tobacco smoke has been associated with growth suppression and an increased frequency of respiratory tract infections in normal children. Is this association more pronounced in children with cystic fibrosis? To answer this question, 43 children (18 girls and 25 boys) attending a 2-week summer camp for cystic fibrosis patients were studied (New England Journal of Medicine, Sept. 20, 1990). Among several variables measured were the child's weight percentile (y) and the number of cigarettes smoked per day in the child's home (x). a. For the 18 girls, the coefficient of correlation between y and x was reported as r = –.50. Interpret - this result. b. Refer to part a. The p-value for testing Ho: p = 0 against H;: p # 0 was reported as p = .03. n Interpret this result. c. For the 25 boys, the coefficient of correlation between y and x was reported asr = -.12. Interpret %3D %3D this result. d. Refer to part c. The p-value for testing Ho: p = 0 against Ha: p #…arrow_forward
- An experiment was conducted to compare the alcohol content of soy sauce on two different production lines. Production was monitored eight times a day. The data are shown here. Production line 1 0.38 0.37 0.39 0.41 0.38 0.39 0.40 0.39 Production line 2 0.48 0.39 0.42 0.52 0.40 0.48 0.52 0.52 Assume both populations are normal. It is suspected that production line 1 is not producing as consistently as production line 2 in terms of alcohol content. Using the 0.05 level of significance, can conclude that the population standard deviations for the alcohol content of these two types of production lines could be the same.arrow_forwardAn experiment was conducted to compare the alcohol content of soy sauce on two different production lines. Production was monitored eight times a day. The data are shown here. Production line 1 0.38 0.37 0.39 0.41 0.38 0.39 0.40 0.39 Production line 2 0.48 0.39 0.42 0.52 0.40 0.48 0.52 0.52 Assume both populations are normal. It is suspected that production line 1 is not producing as consistently as production line 2 in terms of alcohol content. Perform a hypothesis test to compare the population standard deviation of these two types of production lines. What is the value of the test statistic?arrow_forwardA research firm regularly conducts customer satisfaction surveys for an amusement park. A survey of 200 randomly selected park visitors on a weekday in May concluded the average age of visitors to the park was 39 years. When the survey was repeated with 200 randomly selected park visitors on a Saturday in May, the average age of visitors to the park was determined to be 17 years. What possible explanation is there for the large difference in age between the two samples?arrow_forward
 Glencoe Algebra 1, Student Edition, 9780079039897...AlgebraISBN:9780079039897Author:CarterPublisher:McGraw Hill
 College Algebra (MindTap Course List)AlgebraISBN:9781305652231Author:R. David Gustafson, Jeff HughesPublisher:Cengage Learning