
OPERATIONS MANAGEMENT LL PACKAGE
11th Edition
ISBN: 9781323592632
Author: KRAJEWSKI
Publisher: Pearson Custom Publishing
expand_more
expand_more
format_list_bulleted
Concept explainers
Question
Chapter 3, Problem 2P
Summary Introduction
To calculate:
Use the table below,Establish control limits for sample mean and ranges for the car wash process.
Expert Solution & Answer
Want to see the full answer?
Check out a sample textbook solution
Students have asked these similar questions
BlueMoon Bottlers has a bottle-filling process with a mean value of 64 ounces and a standard deviation of 8 ounces. Suppose the upper and lower specification limits are 71 and 57 ounces, respectively. What is the process capability index of this process? (Note: You MUST show every single step and detailed derivation for full credit)
At Isogen Pharmaceuticals, the filling process for its asthma inhaler is set to dispense
140 milliliters (ml) of steroid solution per container. The average range for a sample of 3 containers is 4 ml. use the accompanying table to establish control limits for sample means and ranges for the filling process.
x-chart
and R-chart
Size of Sample (n)
Factor for UCL and LCL for
x-chart
(A2)
Factor for LCL for R-Chart
(D3)
Factor for UCL for R-Chart
(D4)
2
1.880
0
3.267
3
1.023
0
2.575
4
0.729
0
2.282
5
0.577
0
2.115
6
0.483
0
2.004
7
0.419
0.076
1.924
8
0.373
0.136
1.864
9
0.337
0.184
1.816
10
0.308
0.223
1.777
The
UCLR
equals
to what
ml and the
LCLR
equals
to what
ml. (Enter your responses rounded to two decimal places.)
The
UCLx
equals
to what
ml and the
LCLx
is what
ml. (Enter your responses rounded to two decimal places.)
At Quick Car Wash, the wash process is advertised to take less than
7
minutes. Consequently, management has set a target average of
390
seconds for the wash process. Suppose the average range for a sample of
9
cars is
8
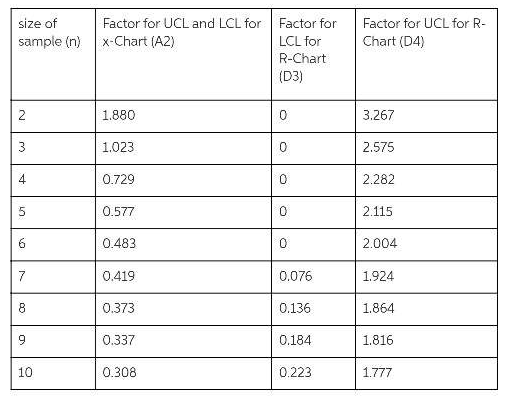
seconds. Use the accompanying table to establish control limits for sample means and ranges for the car wash process.
LOADING...
Click the icon to view the table of factors for calculating three-sigma limits for the
x overbarx-chart
and R-chart.
Factors for calculating three-sigma limits for the
x overbarx-chart
and R-chart
Size of Sample (n)
Factor for UCL and LCL for
x overbarx-chart
(Upper A 2A2)
Factor for LCL for R-Chart
(Upper D 3D3)
Factor for UCL for R-Chart
(Upper D 4D4)
2
1.8801.880
00
3.2673.267
3
1.0231.023
00
2.5752.575
4
0.7290.729
00
2.2822.282
5
0.5770.577
00
2.1152.115
6
0.4830.483
00
2.0042.004
7
0.4190.419
0.0760.076
1.9241.924
8
0.3730.373…
Chapter 3 Solutions
OPERATIONS MANAGEMENT LL PACKAGE
Ch. 3 - Should a very pricey handcrafted object of beauty...Ch. 3 - Prob. 2DQCh. 3 - Prob. 3DQCh. 3 - Prob. 1PCh. 3 - Prob. 2PCh. 3 - Prob. 3PCh. 3 - Prob. 4PCh. 3 - Prob. 5PCh. 3 - Prob. 6PCh. 3 - Prob. 7P
Ch. 3 - Prob. 8PCh. 3 - Prob. 9PCh. 3 - Prob. 10PCh. 3 - Prob. 11PCh. 3 - Prob. 12PCh. 3 - Prob. 13PCh. 3 - Prob. 14PCh. 3 - Prob. 15PCh. 3 - Prob. 16PCh. 3 - Prob. 17PCh. 3 - Prob. 18PCh. 3 - Prob. 19PCh. 3 - Prob. 20PCh. 3 - Prob. 21PCh. 3 - Prob. 22PCh. 3 - Prob. 23PCh. 3 - Prob. 24PCh. 3 - Prob. 26PCh. 3 - Prob. 27PCh. 3 - Prob. 28PCh. 3 - Prob. 29PCh. 3 - Prob. 31PCh. 3 - Prob. 1AMECh. 3 - Prob. 2AMECh. 3 - Prob. 3AMECh. 3 - Prob. 4AMECh. 3 - Prob. 5AMECh. 3 - Prob. 1VCCh. 3 - Prob. 2VCCh. 3 - Prob. 3VC
Knowledge Booster


Learn more about
Need a deep-dive on the concept behind this application? Look no further. Learn more about this topic, operations-management and related others by exploring similar questions and additional content below.Similar questions
- At Quick Car Wash, the wash process is advertised to take less than 7 minutes. Consequently, management has set a target average of 390 seconds for the wash process. Suppose the average range for a sample of 9 cars is 8 seconds. Use the accompanying table to establish control limits for sample means and ranges for the car wash process. LOADING... Click the icon to view the table of factors for calculating three-sigma limits for the x overbarx-chart and R-chart. Factors for calculating three-sigma limits for the x overbarx-chart and R-chart Size of Sample (n) Factor for UCL and LCL for x overbarx-chart (Upper A 2A2) Factor for LCL for R-Chart (Upper D 3D3) Factor for UCL for R-Chart (Upper D 4D4) 2 1.8801.880 00 3.2673.267 3 1.0231.023 00 2.5752.575 4 0.7290.729 00 2.2822.282 5 0.5770.577 00 2.1152.115 6 0.4830.483 00 2.0042.004 7 0.4190.419 0.0760.076 1.9241.924 8 0.3730.373…arrow_forwardAt Quick Car Wash, the wash process is advertised to take less than 8 minutes. Consequently, management has set a target average of 440 seconds for the wash process. Suppose the average range for a sample of 9 cars is 10 seconds. Use the accompanying table to establish control limits for sample means and ranges for the car wash process. Factors for calculating three-sigma limits for the x-chart and R-chart Size of Sample (n) Factor for UCL and LCL for x-chart (A2) Factor for LCL for R-Chart (D3) Factor for UCL for R-Chart (D4) 2 1.880 0 3.267 3 1.023 0 2.575 4 0.729 0 2.282 5 0.577 0 2.115 6 0.483 0 2.004 7 0.419 0.076 1.924 8 0.373 0.136 1.864 9 0.337 0.184 1.816 10 0.308 0.223 Part 2 The UCLR equals enter your response here seconds and the LCLR equals enter your response here seconds. (Enter your responses rounded to two decimal places.)arrow_forwardDesigning an x -Chart Using the Process Standard DeviationThe Sunny Dale Bank monitors the time required to serve customers at the drive-through window because it is an important quality factor in competing with other banks in the city. After analyzing the data gathered in an extensive study of the window operation, bank management determined that the mean time to process a customer at the peak demand period is 5 minutes, with a standard deviation of 1.5 minutes. Management wants to monitor the mean time to process a customer by periodically using a sample size of six customers. Assume that the process variability is in statistical control. Design an x-chart that has a type I error of 5 percent. That is, set the control limits so that there is a 2.5 percent chance a sample result will fall below the LCL and a 2.5 percent chance that a sample result will fall above the UCL. After several weeks of sampling, two successive samples came in at 3.70 and 3.68 minutes, respectively. Is the…arrow_forward
- Resistors for electronic circuits are manufactured on a high-speed automated machine. The machine is set up to produce a large run of resistors of 1,000 ohms each. Use Exhibit 13.7. To set up the machine and to create a control chart to be used throughout the run, 15 samples were taken with four resistors in each sample. The complete list of samples and their measured values are as follows: Use three-sigma control limits. c. Determine the UCL and LCL for a X−X− chart. (Round your answers to 3 decimal places.) d. Determine the UCL and LCL for R-chart. (Leave no cells blank - be certain to enter "0" wherever required. Round your answers to 3 decimal places.)arrow_forwardA bottle-filling process has a lower specification limit of 0.99 liter and an upperspecification limit of 1.01 liters. The standard deviation is 0.005 liter and the mean is 1 liter.What is the process capability index for the bottle-filling process?arrow_forwardUsing appropriate examples, distinguish between ‘attributes’ and ‘variables’ with regards to the measures of quality in Statistical Process Control.arrow_forward
- Rosters Chicken advertises " lite" chicken with 30% fewer calories than standard chicken. When the process for "lite" chicken breast production is in control, the average chicken breast contains 420 calories, and the standard deviation in caloric content of the chicken breast population is 25 calories. Rosters wants to design an x-chart to monitor the caloric content of chicken breasts, where 25 chicken breasts would be chosen at random to form each sample.a) What are the lower and upper control limits for th.is chart if these limits are chosen to be four standard deviations from the target?b) What a re the limits with three standard deviations from the target?arrow_forward1. An ad agency tracks the complaints, by week received, about the billboards in its city: Week No. of Complaints 1 8 2 4 3 11 4 16 5 8 6 9 This exercise contains only parts a, b, and c. a) The type of control chart that is best to monitor this process is c minus chartc−chart . b) Using z = 3, the control chart limits for this process are (assume that the historical complaints rate is unknown): UCLc =?complaints per week (round your response to two decimal places). LCLc =?complaints per week (round your response to two decimal places).arrow_forward7. An ad agency tracks the complaints, by week received, about the billboards in its city: Week No. of Complaints 1 3 2 6 3 4 4 12 5 2 6 9 This exercise contains only parts a, b, and c. Part 2 a) The type of control chart that is best to monitor this process is c minus chart ______ . Part 3 b) Using z = 3, the control chart limits for this process are (assume that the historical complaints rate is unknown): UCLc = ________ complaints per week (round your response to two decimal places). The upper control limit is: ________ The lower control limit is: _________ The central limit is ___________arrow_forward
- what types of error are attached in statistical process control? define and draw example. Sub: operation and supply chain managementarrow_forwardA. Choudhury’s bowling ball factory in Illinois makes bowling balls of adult size and weight only. The standard devia-tion in the weight of a bowling ball produced at the factory is known to be 0.12 pounds. Each day for 24 days, the averageweight, in pounds, of nine of the bowling balls produced that dayhas been assessed as follows: a) Establish a control chart for monitoring the average weights of the bowling balls in which the upper and lower control lim-its are each two standard deviations from the mean. What are the values of the control limits?b) If three standard deviations are used in the chart, how do thesevalues change? Why?arrow_forward8 A pizza delivery service wants to track their delivery times. They take eight samples of four deliveries and record the following data. What are the upper and lower control limits of their X-bar chart? (Note: Although it looks similar, the data in the table below is different from the data in the table relating to the UCL and LCL for the R chart.) Sample # 1 2 3 4 5 6 7 8 Item #1 21.1 20.2 24.6 22.6 23.7 20.9 22.4 20.7 Item #2 22.2 20.6 20 20.7 24.1 23.9 24.6 24.4 Item #3 23.0 24.5 23.2 23.0 20.7 22.8 23.0 22.8 Item #4 20.0 23.5 25.5 25.0 20.7 23.2 23.3 24.5 Sum 86.3 88.8 93.3 91.3 89.2 90.8 93.3 92.4 Group of answer choices 25.2, 20.0 25.4, 20.0 23.9, 21.3 24.1, 21.1arrow_forward
arrow_back_ios
SEE MORE QUESTIONS
arrow_forward_ios
Recommended textbooks for you
 Practical Management ScienceOperations ManagementISBN:9781337406659Author:WINSTON, Wayne L.Publisher:Cengage,
 Operations ManagementOperations ManagementISBN:9781259667473Author:William J StevensonPublisher:McGraw-Hill Education
 Operations and Supply Chain Management (Mcgraw-hi...Operations ManagementISBN:9781259666100Author:F. Robert Jacobs, Richard B ChasePublisher:McGraw-Hill Education
 Purchasing and Supply Chain ManagementOperations ManagementISBN:9781285869681Author:Robert M. Monczka, Robert B. Handfield, Larry C. Giunipero, James L. PattersonPublisher:Cengage Learning
 Production and Operations Analysis, Seventh Editi...Operations ManagementISBN:9781478623069Author:Steven Nahmias, Tava Lennon OlsenPublisher:Waveland Press, Inc.
Practical Management Science
Operations Management
ISBN:9781337406659
Author:WINSTON, Wayne L.
Publisher:Cengage,
Operations Management
Operations Management
ISBN:9781259667473
Author:William J Stevenson
Publisher:McGraw-Hill Education
Operations and Supply Chain Management (Mcgraw-hi...
Operations Management
ISBN:9781259666100
Author:F. Robert Jacobs, Richard B Chase
Publisher:McGraw-Hill Education
Purchasing and Supply Chain Management
Operations Management
ISBN:9781285869681
Author:Robert M. Monczka, Robert B. Handfield, Larry C. Giunipero, James L. Patterson
Publisher:Cengage Learning
Production and Operations Analysis, Seventh Editi...
Operations Management
ISBN:9781478623069
Author:Steven Nahmias, Tava Lennon Olsen
Publisher:Waveland Press, Inc.