
Concept explainers
Videos
(a)
To Explain: the
(a)
Explanation of Solution
Given:
Calculation:
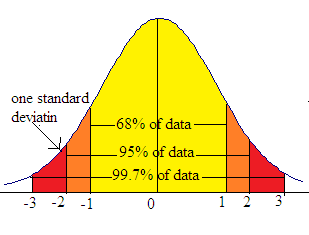
Knowing that 95% of the data lie within two standard deviations of the mean
Therefore the middle 95% lie between -21% and 45%
Graph:
(b)
To Calculate: the proportion of years is the market down.
(b)
Answer to Problem 3.55RE
23.27%
Explanation of Solution
Given:
Formula used:
Calculation:
Explanation:
Raw containing the correct integer 10th of z score (-0.7) and the column containing the corresponding 100th of z score (0.03)
0.2327=23.27%
Therefore about 23.27% has an index of less than 0
(c)
To Calculate: the proportion of years does the index gain between 15% and 25%.
(c)
Answer to Problem 3.55RE
21.38%
Explanation of Solution
Given:
Formula used:
Calculation:
Probability x that the index is between 15% and 25%
For
For
The difference between 78.52% and 57.14 is
78.52%-57.14%=21.38%
Therefore about 21.38% has an index between 15% and 25%
Chapter 3 Solutions
Statistics Through Applications
Additional Math Textbook Solutions
Elementary Statistics
Basic Business Statistics, Student Value Edition (13th Edition)
Intro Stats, Books a la Carte Edition (5th Edition)
Essentials of Statistics, Books a la Carte Edition (5th Edition)
Elementary Statistics (13th Edition)


 MATLAB: An Introduction with ApplicationsStatisticsISBN:9781119256830Author:Amos GilatPublisher:John Wiley & Sons Inc
 Probability and Statistics for Engineering and th...StatisticsISBN:9781305251809Author:Jay L. DevorePublisher:Cengage Learning
 Statistics for The Behavioral Sciences (MindTap C...StatisticsISBN:9781305504912Author:Frederick J Gravetter, Larry B. WallnauPublisher:Cengage Learning
 Elementary Statistics: Picturing the World (7th E...StatisticsISBN:9780134683416Author:Ron Larson, Betsy FarberPublisher:PEARSON
 The Basic Practice of StatisticsStatisticsISBN:9781319042578Author:David S. Moore, William I. Notz, Michael A. FlignerPublisher:W. H. Freeman
 Introduction to the Practice of StatisticsStatisticsISBN:9781319013387Author:David S. Moore, George P. McCabe, Bruce A. CraigPublisher:W. H. Freeman