
Concept explainers
Videos
To Explain: the point that is one standard deviation below the mean is a
Explanation of Solution
There 68 percent of the data would be between one standard deviation below and above the mean and therefore 35 percent between one standard deviation below the mean and mean itself.
Also knowing that 50 percent of the data lies before he mean so therefore
50% - 34% = 16%
Lies before 1 standard deviation below the mean and therefore this is the 16th percentile
Graph:
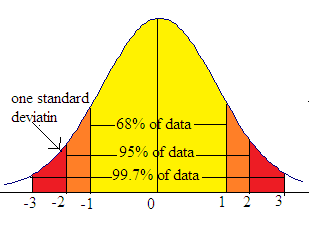
95 percent of the data is between two standard deviation which below the mean. Therefore 5 percent is not between these two values
But the normal density curve is symmetric, then 2.5% lies below two standard deviations below the men and therefore in 97.5% of the data lies below two standard deviations above the mean. It means that 2 standard deviations above the mean is the 97.5th percentile.
Chapter 3 Solutions
Statistics Through Applications
Additional Math Textbook Solutions
Elementary Statistics Using Excel (6th Edition)
Introductory Statistics
Intro Stats, Books a la Carte Edition (5th Edition)
Statistics: The Art and Science of Learning from Data (4th Edition)
Basic Business Statistics, Student Value Edition (13th Edition)
Essentials of Statistics (6th Edition)


 MATLAB: An Introduction with ApplicationsStatisticsISBN:9781119256830Author:Amos GilatPublisher:John Wiley & Sons Inc
 Probability and Statistics for Engineering and th...StatisticsISBN:9781305251809Author:Jay L. DevorePublisher:Cengage Learning
 Statistics for The Behavioral Sciences (MindTap C...StatisticsISBN:9781305504912Author:Frederick J Gravetter, Larry B. WallnauPublisher:Cengage Learning
 Elementary Statistics: Picturing the World (7th E...StatisticsISBN:9780134683416Author:Ron Larson, Betsy FarberPublisher:PEARSON
 The Basic Practice of StatisticsStatisticsISBN:9781319042578Author:David S. Moore, William I. Notz, Michael A. FlignerPublisher:W. H. Freeman
 Introduction to the Practice of StatisticsStatisticsISBN:9781319013387Author:David S. Moore, George P. McCabe, Bruce A. CraigPublisher:W. H. Freeman