
Concept explainers
Videos
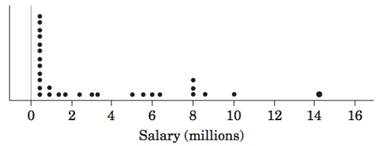
To calculate the value of percentile and z score for Madson’s salary and then explain it.
Answer to Problem 3.6E
Percentile: 50th percentile
Z score: -0.53
Explanation of Solution
Given:
| Player | Salary | Player | Salary | Player | Salary |
| Burrell, Pat | 1,42,50,000 | Romero, J. C. | 32,50,000 | Kendrick, Kyle | 4,45,000 |
| Howard, Ryan | 1,00,00,000 | Feliz, Pedro | 30,00,000 | Dobbs, Greg | 4,40,000 |
| Myers, Brett | 85,83,333 | Helms, Wes | 24,00,000 | Ruiz, Carlos | 4,25,000 |
| Rollins, Jimmy | 80,00,000 | Werth, Jayson | 17,00,000 | Condrey, Clayton | 4,20,000 |
| Eaton, Adam | 79,58,333 | Madson, Ryan | 14,00,000 | Coste, Chris | 4,15,000 |
| Utley, Chase | 77,85,714 | Durbin, Chad | 9,00,000 | Rosario, Francisco | 3,95,000 |
| Lidge, Brad | 63,50,000 | Taguchi, So | 9,00,000 | Zagurski, Mike | 3,92,500 |
| Moyer, Jamie | 60,00,000 | Bruntlett, Eric | 6,00,000 | Lahey, Tim | 3,90,000 |
| Gordon, Tom | 55,00,000 | Hamels, Cole | 5,00,000 | Mathieson, Scott | 3,90,000 |
| Jenkins, Geoff | 50,00,000 | Victorino, Shane | 4,80,000 |
| Variable | Salary |
| n | 29 |
| Mean | 3388617 |
| Standard deviation | 3767484 |
| Minimum | 390000 |
| 440000 | |
| Median | 1400000 |
| Quartile 3 | 6000000 |
| Maximum | 14250000 |
Formula used:
Calculation:
The 50th percentile shows that the madson’s salary is more than 50% of the other player’s salary while the z score equal to -0.53, means that madson’s salary is 0.53 standard deviation less than mean.
Chapter 3 Solutions
Statistics Through Applications
Additional Math Textbook Solutions
Basic Business Statistics, Student Value Edition
Statistical Reasoning for Everyday Life (5th Edition)
Introductory Statistics (2nd Edition)
Fundamentals of Statistics (5th Edition)
STATS:DATA+MODELS-W/DVD
Elementary Statistics: Picturing the World (6th Edition)


 MATLAB: An Introduction with ApplicationsStatisticsISBN:9781119256830Author:Amos GilatPublisher:John Wiley & Sons Inc
 Probability and Statistics for Engineering and th...StatisticsISBN:9781305251809Author:Jay L. DevorePublisher:Cengage Learning
 Statistics for The Behavioral Sciences (MindTap C...StatisticsISBN:9781305504912Author:Frederick J Gravetter, Larry B. WallnauPublisher:Cengage Learning
 Elementary Statistics: Picturing the World (7th E...StatisticsISBN:9780134683416Author:Ron Larson, Betsy FarberPublisher:PEARSON
 The Basic Practice of StatisticsStatisticsISBN:9781319042578Author:David S. Moore, William I. Notz, Michael A. FlignerPublisher:W. H. Freeman
 Introduction to the Practice of StatisticsStatisticsISBN:9781319013387Author:David S. Moore, George P. McCabe, Bruce A. CraigPublisher:W. H. Freeman