
Videos
Although millions of elephants once roamed across Africa, by the mid-1980s elephant populations in African nations had been devastated by poaching. Elephants are important to African ecosystems. In tropical forests, elephants create clearings in the canopy that encourage new tree growth. In savannas, elephants reduce bush cover to create an environment that is favorable to browsing and grazing animals. In addition, the seeds of many plant species depend on passing through an elephant’s digestive tract before germination.
The status of the elephant now varies greatly across the continent. In some nations, strong measures have been taken to effectively protect elephant populations; for example, Kenya has destroyed over five tons of elephant ivory confiscated from poachers in an attempt to deter the growth of illegal ivory trade (Associated Press, July 20, 2011). In other nations the elephant populations remain in danger due to poaching for meat and ivory, loss of habitat,
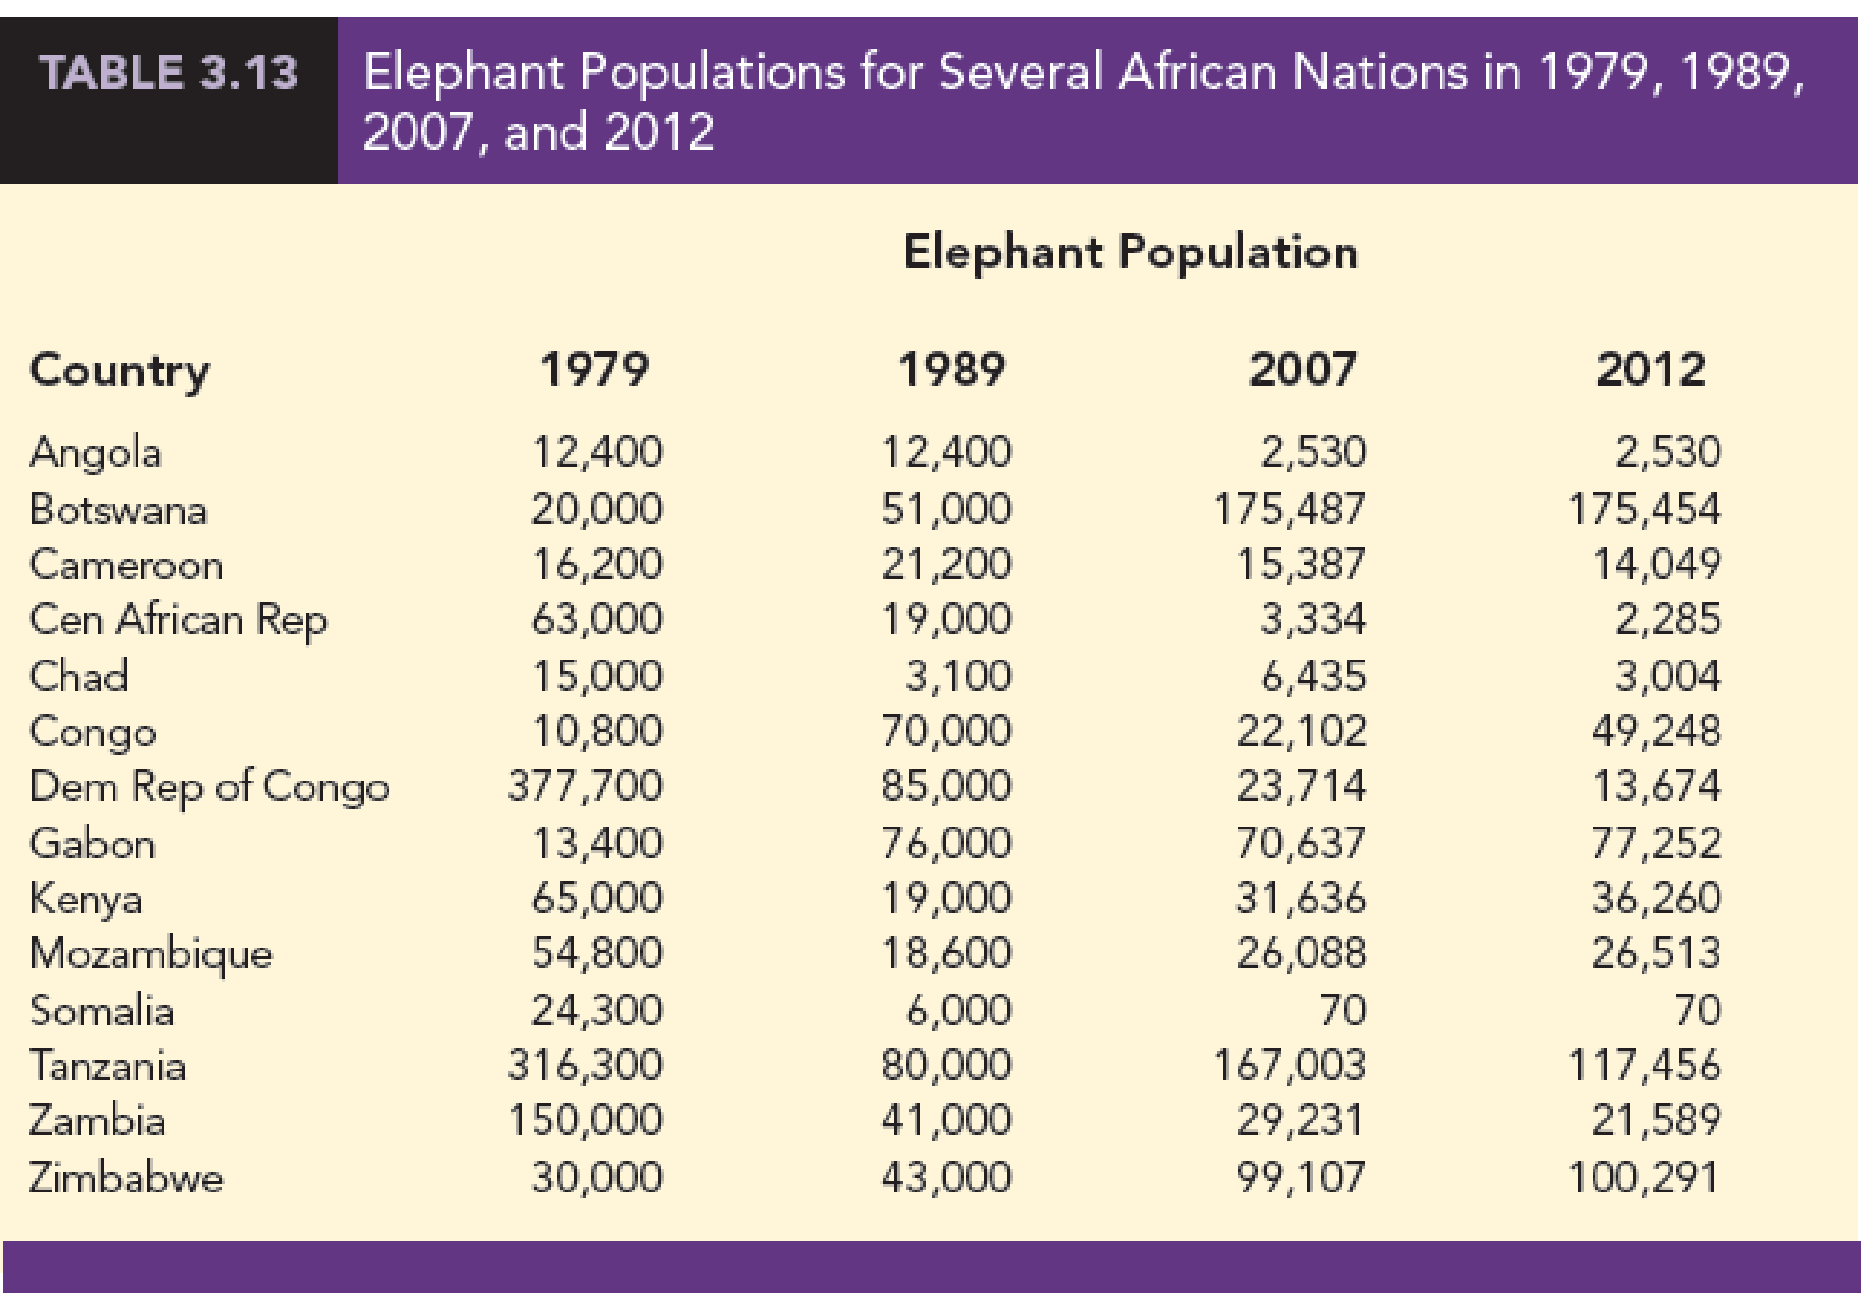
and conflict with humans. Table 3.13 shows elephant populations for several African nations in 1979, 1989, 2007, and 2012 (ElephantDatabase.org website).
The David Sheldrick Wildlife Trust was established in 1977 to honor the memory of naturalist David Leslie William Sheldrick, who founded Warden of Tsavo East National Park in Kenya and headed the Planning Unit of the Wildlife Conservation and Management Department in that country. Management of the Sheldrick Trust would like to know what these data indicate about elephant populations in various African countries since 1979.
Managerial Report
Use methods of
- 1. The mean annual change in elephant population for each country in the 10 years from 1979 to 1989, and a discussion of which countries saw the largest changes in elephant population over this 10-year period.
- 2. The mean annual change in elephant population for each country from 1989 to 2007, and a discussion of which countries saw the largest changes in elephant population over this 18-year period.
- 3. The mean annual change in elephant population for each country from 2007 to 2012, and a discussion of which countries saw the largest changes in elephant population over this 5-year period.
- 4. A comparison of your results from parts 1, 2, and 3, and a discussion of the conclusions you can draw from this comparison.

Trending nowThis is a popular solution!

Chapter 3 Solutions
Essentials Of Statistics For Business & Economics


- Redo Exercise 5, assuming that the house blend contains 300 grams of Colombian beans, 50 grams of Kenyan beans, and 150 grams of French roast beans and the gourmet blend contains 100 grams of Colombian beans, 350 grams of Kenyan beans, and 50 grams of French roast beans. This time the merchant has on hand 30 kilograms of Colombian beans, 15 kilograms of Kenyan beans, and 15 kilograms of French roast beans. Suppose one bag of the house blend produces a profit of $0.50, one bag of the special blend produces a profit of $1.50, and one bag of the gourmet blend produces a profit of $2.00. How many bags of each type should the merchant prepare if he wants to use up all of the beans and maximize his profit? What is the maximum profit?arrow_forwardSuppose the coal and steel industries form a closed economy. Every $1 produced by the coal industry requires $0.30 of coal and $0.70 of steel. Every $1 produced by steel requires $0.80 of coal and $0.20 of steel. Find the annual production (output) of coal and steel if the total annual production is $20 million.arrow_forward
 Linear Algebra: A Modern IntroductionAlgebraISBN:9781285463247Author:David PoolePublisher:Cengage Learning
 Algebra for College StudentsAlgebraISBN:9781285195780Author:Jerome E. Kaufmann, Karen L. SchwittersPublisher:Cengage Learning
 College AlgebraAlgebraISBN:9781305115545Author:James Stewart, Lothar Redlin, Saleem WatsonPublisher:Cengage Learning
 Algebra and Trigonometry (MindTap Course List)AlgebraISBN:9781305071742Author:James Stewart, Lothar Redlin, Saleem WatsonPublisher:Cengage Learning