Concept explainers
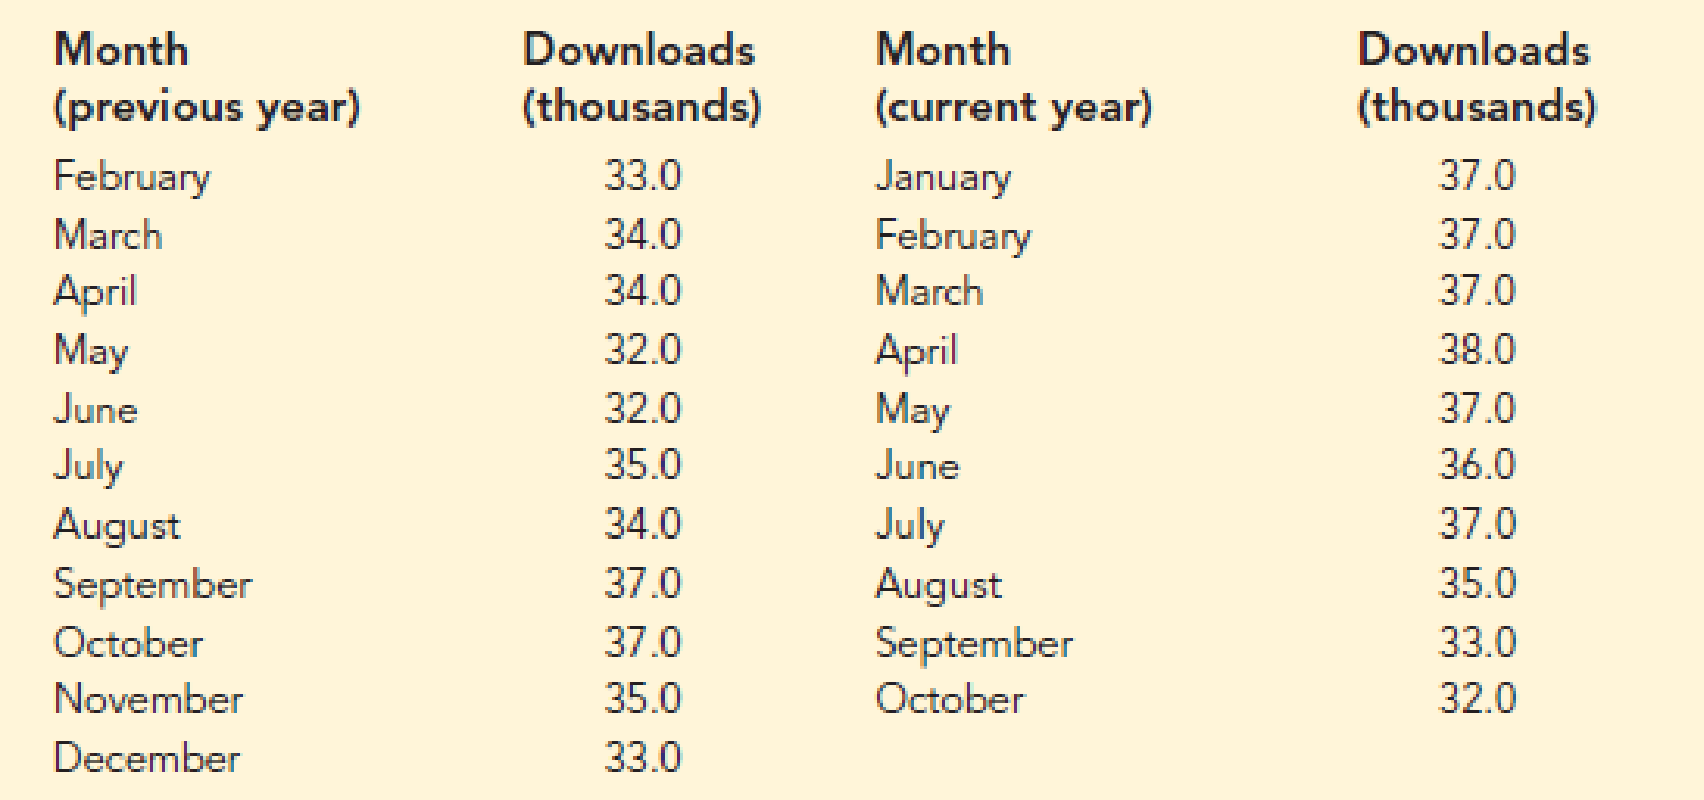
Online Multiplayer Game Downloads. The creator of a new online multiplayer survival game has been tracking the monthly downloads of the newest game. The following table shows the monthly downloads (in thousands) for each month of the current and previous year.
- a. Compute the
mean ,median , andmode for number of downloads in the previous year. - b. Compute the mean, median, and mode for number of downloads in the current year.
- c. Compute the first and third
quartiles for downloads in the previous year. - d. Compute the first and third quartiles for downloads in the current year.
- e. Compare the values calculated in parts a through d for the previous and current years. What does this tell you about the downloads of the game in the current year compared to the previous year?
a.

Find the mean, median and mode for the number of downloads in previous year.
Answer to Problem 12E
The mean, median and mode for the number of downloads in previous year are 34.1818, 34, and 34, respectively.
Explanation of Solution
Calculation:
The data represent the monthly downloads (in thousands) for 11 months in previous year and monthly downloads (in thousands) for 10 months in current year.
Software Procedure:
Step by step procedure to obtain the descriptive statistics using EXCEL is as follows:
- In an EXCEL sheet enter the observations of first sample and label it as Previous.
- Go to Data > Data Analysis (in case it is not default, take the Analysis ToolPak from Excel Add Ins) > Descriptive statistics.
- Enter Input Range as $A$2:$A$12, select Columns in Grouped By, tick on Summary statistics.
- Click on OK.
Output using EXCEL is given as follows:
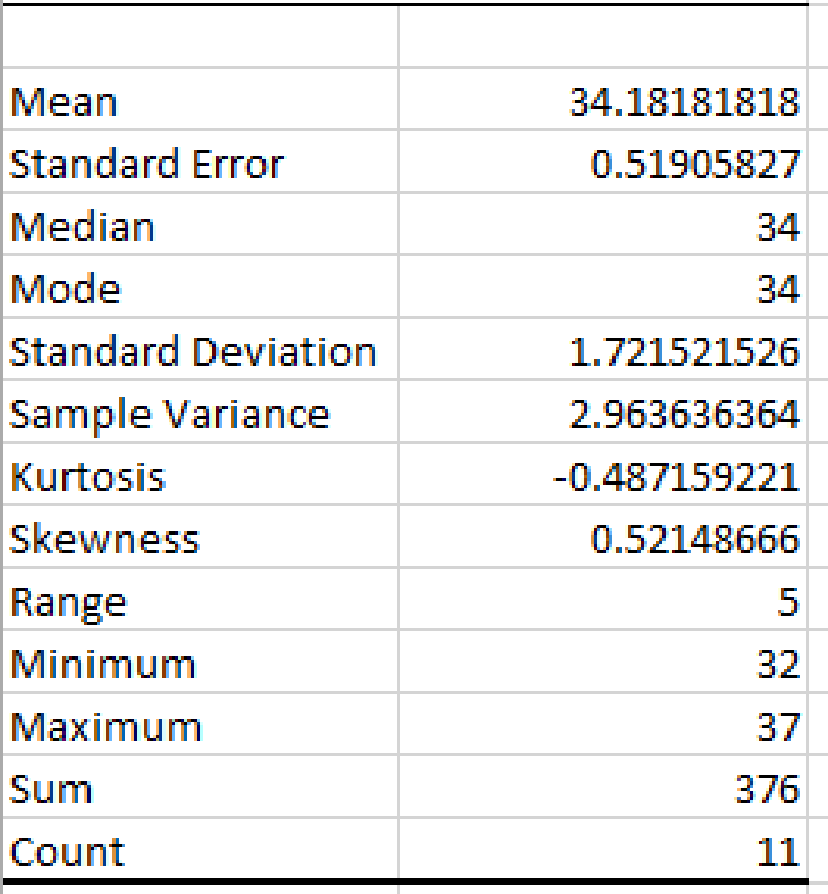
From the EXCEL output, mean, median, and mode for the number of downloads in previous year are 34.1818, 34, and 34, respectively.
Thus, the mean, median, and mode for the number of downloads in previous year are 34.1818, 34, and 34, respectively.
b.

Find the mean, median and mode for the number of downloads in current year.
Answer to Problem 12E
The mean, median and mode for the number of downloads in current year are 35.9, 37, and 37, respectively.
Explanation of Solution
Calculation:
Software Procedure:
Step by step procedure to obtain the descriptive statistics using EXCEL is as follows:
- In an EXCEL sheet enter the observations of second sample and label it as Current.
- Go to Data > Data Analysis (in case it is not default, take the Analysis ToolPak from Excel Add Ins) > Descriptive statistics.
- Enter Input Range as $A$2:$A$11, select Columns in Grouped By, tick on Summary statistics.
- Click on OK.
Output using EXCEL is given as follows:
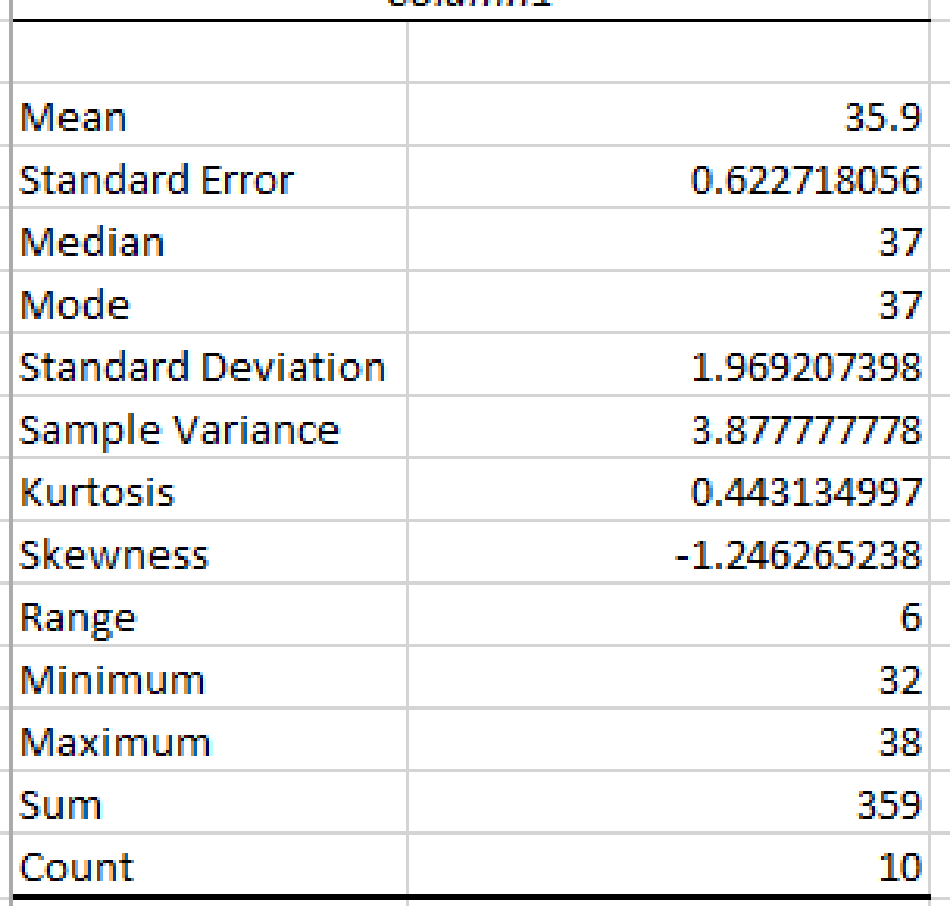
From the EXCEL output, mean, median and mode for the number of downloads in current year are 35.9, 37, and 37, respectively.
Thus, the mean, median and mode for the number of downloads in current year are 35.9, 37, and 37, respectively.
c.

Find the first and third quartiles fir downloads in previous year.
Answer to Problem 12E
The first and third quartiles fir downloads in previous year are
Explanation of Solution
Calculation:
The first and third quartiles are obtained using EXCEL functions.
First quartile:
The EXCEL function to compute first quartile is
Software Procedure:
Step by step procedure to obtain the first quartile using EXCEL is as follows:
- In an EXCEL sheet enter the observations of first sample and label it as Previous.
- In a cell enter the formula QUARTILE.EXC ($A$2:$A$12,1).
- Click on OK.
Output using EXCEL is given as follows:
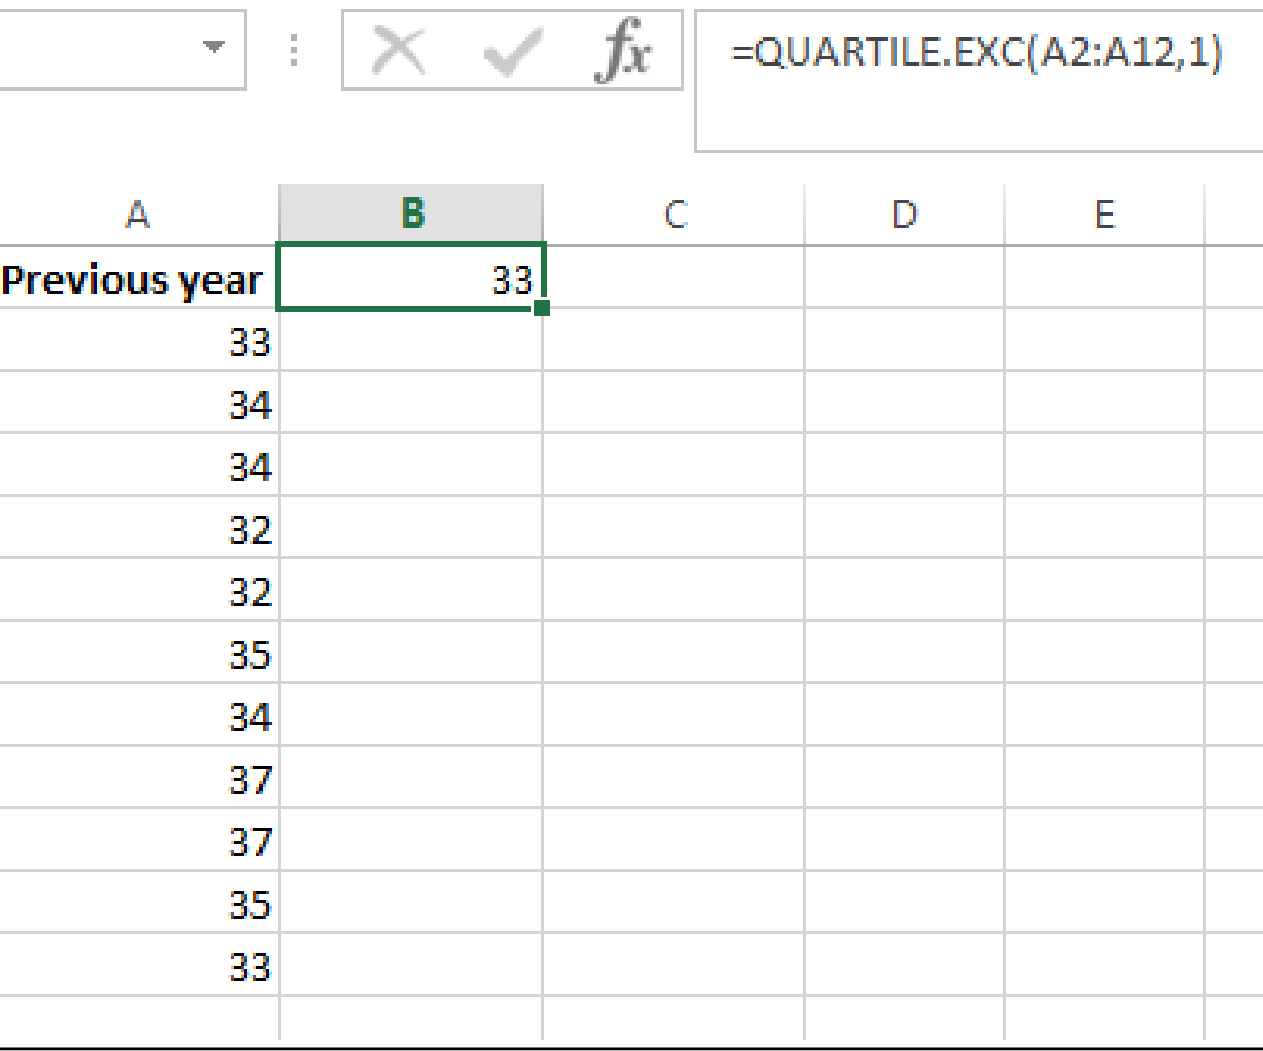
From the EXCEL output, the first quartile is 33.
Third quartile:
The EXCEL function to compute third quartile is
Software Procedure:
Step by step procedure to obtain the third quartile using EXCEL is as follows:
- In an EXCEL sheet enter the observations of first sample and label it as Previous.
- In a cell enter the formula QUARTILE.EXC ($A$2:$A$12,3).
- Click on OK.
Output using EXCEL is given as follows:
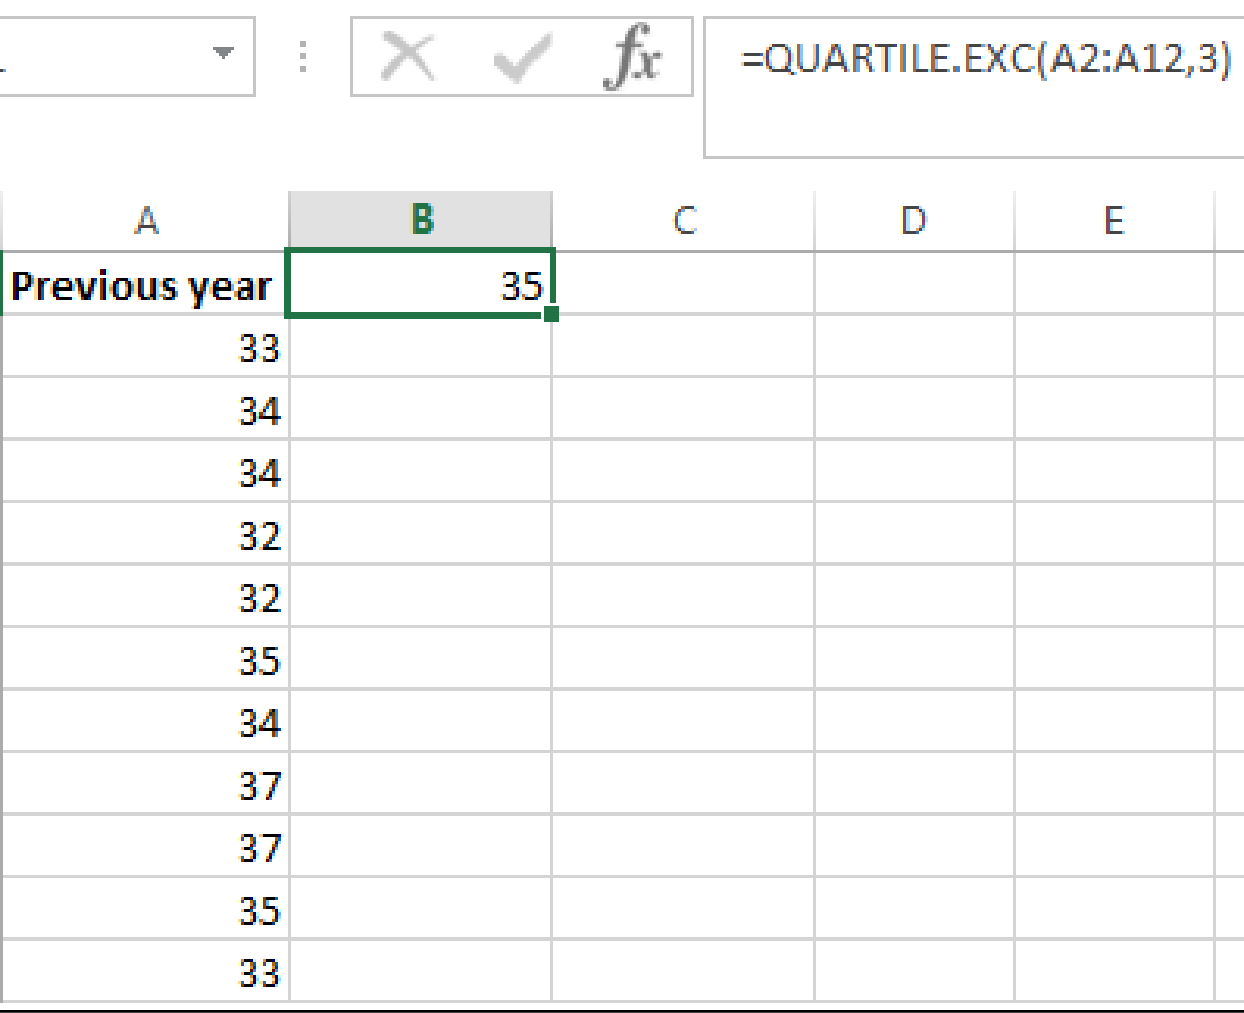
From the EXCEL output, the third quartile is 35.
Thus, the first and third quartiles fir downloads in previous year are
d.

Find the first and third quartiles fir downloads in current year.
Answer to Problem 12E
The first and third quartiles fir downloads in current year are
Explanation of Solution
Calculation:
The first and third quartiles are obtained using EXCEL functions.
First quartile:
The EXCEL function to compute first quartile is
Software Procedure:
Step by step procedure to obtain the first quartile using EXCEL is as follows:
- In an EXCEL sheet enter the observations of second sample and label it as Current.
- In a cell enter the formula QUARTILE.EXC ($A$2:$A$11,1).
- Click on OK.
Output using EXCEL is given as follows:
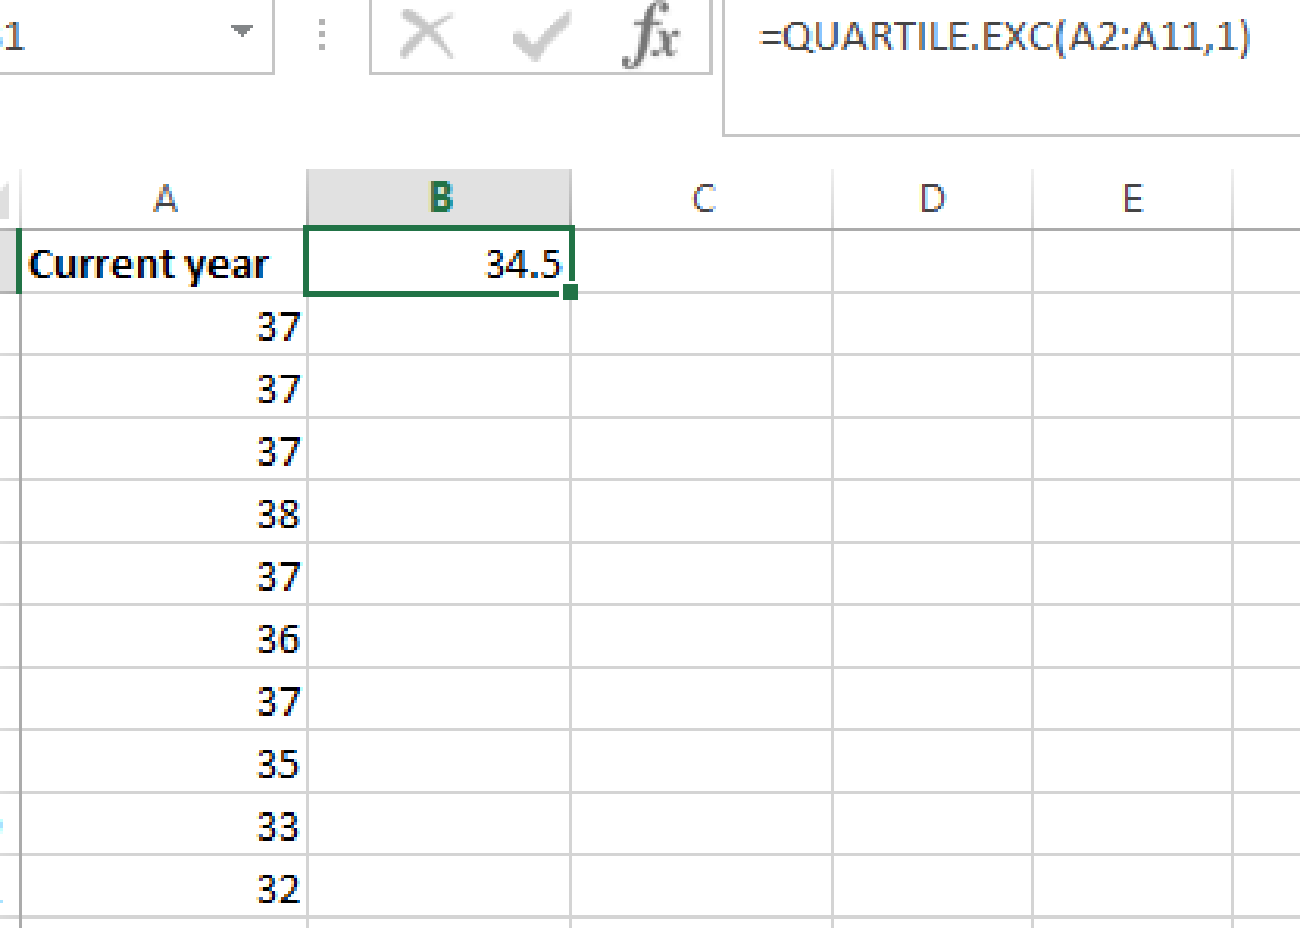
From the EXCEL output, the first quartile is 34.5.
Third quartile:
The EXCEL function to compute third quartile is
Software Procedure:
Step by step procedure to obtain the third quartile using EXCEL is as follows:
- In an EXCEL sheet enter the observations of second sample and label it as Current.
- In a cell enter the formula QUARTILE.EXC ($A$2:$A$11,3).
- Click on OK.
Output using EXCEL is given as follows:
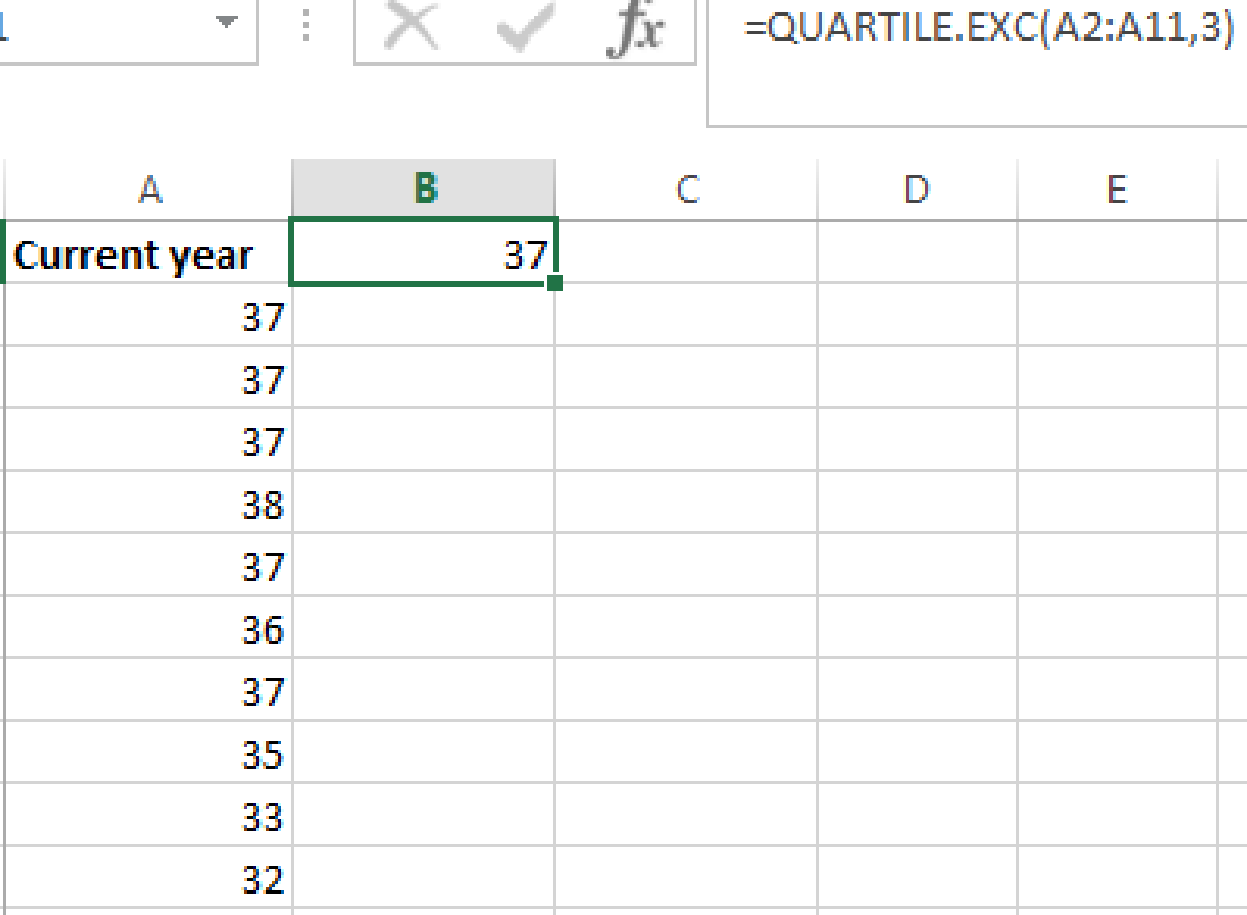
From the EXCEL output, the third quartile is 37.
Thus, the first and third quartiles for downloads in current year are
e.

Compare the values of mean, median, mode, and quartiles for the two samples.
Explanation of Solution
The mean, median, and mode for the number of downloads in previous year are 34.1818, 34, and 34, respectively.
The first and third quartiles for downloads in previous year are
The mean, median and mode for the number of downloads in current year are 35.9, 37, and 37, respectively.
The first and third quartiles for downloads in current year are
Here, all the values of mean, median, mode, first quartile, and third quartile are higher for the sample of current year.
From this it can be said that, the number of downloads are more in current year than in previous year.
Want to see more full solutions like this?
Chapter 3 Solutions
Essentials Of Statistics For Business & Economics
- Final grades The data show the final grades for 16 randomly selected students in College Algebra and Statistics. Find the y- value for the specified x-value. Remember that no regression should be done when r is not significant. Student 2 3 4 5 6 7 8 College 89 56 99 61 74 57 98 95 HARRERS 75 55 64 62 80 70 93 91 Student 9 10 11 12 13 14 15 16 College 98 87 89 73 66 88 79 56 SABERS 92 71 89 79 76 78 68 57 Send data to Excel The correlation coefficient for the data is r=0.684 and a=0.01. Should regression analysis be done? The regression analysis should not be done. The regression analysis should be done. Find the equation of the regression line. Round the coefficients to at least three decimal places. y'=a+bx a = b= Find the predicted grade in Statistics when the College Algebra grade was 86. Round the answer to at least three decimal places. When a student gets 86 in College Algebra, we predict a, Statistics score of . Continue × G Subnet Assignment F4 F5 95 ཀུན DII D F6 F7 FB F9 F10…arrow_forward= 5 6 = 7 8 9 10 11 12 13 14 15 16 Emergency Escape Plan A random sample of 180 residents of the Southeastern United States found 117 had no emergency escape plan for severe weather. Find the 90% confidence interval of the true proportion of individuals living in the Southeastern United States who do not have an emergency escape plan for severe weather. Use a graphing calculator. Round your answers to three decimal places. X 1 G Continue Q * F2 A 2 N # *3 80 a F3 F4 FS $ 54 % 5 + 80 G H J 9 K B N M F11 יד F12 0 P } 1 L ... Λ . H command option.arrow_forwardCigarette Smoking A researcher found that a cigarette smoker smokes on average 31 cigarettes a day. She feels that this average is too high. She selected a random sample of 8 smokers and found that the mean number of cigarettes they smoked per day was 28. The sample standard deviation was 2.9. At a 0.01, is there enough evidence to support her claim? Assume that the population is approximately normally distributed. Use the critical value method and tables. Part: 0/5 Part 1 of 5 (a) State the hypotheses and identify the claim. μ ローロ 0arrow_forwardAccidents and Drivers' Ages For a random selection of drivers, their ages and the number of automobile accidents that they had over a 3-year period are shown. Is there a linear relationship between the variables? Use Age for the independent variable and Accidents for the dependent variable. 27 25 42 31 43 22 24 39 Age Accidents 4 3101562 Send data to Excel Part: 0/5 Part 1 of 5 (a) Draw the scatter plot for the variables. Drivers' Age and Accidents 10- Accidents 8- 7 3 2. 14 0 3 10 15 20 25 30 35 Age x Part: 1/5 Part 2 of 5 (b) Compute the value of the correlation coefficient. Round your answer to at least three decimal places. x Part: 2/5 Part 3 of 5 (c) State the hypotheses. Continue * 80 F3 a F4 # $ % G F5 < Submit Assignment 2025 McGraw Hill LLC. All Rights Reserved. Terms of Use Privacy Center 1 Accessibility F6 & ཊུ8 DII A F7 F8 F9 F10arrow_forwardFast Food A deli manager wishes to see if there is a preference for the four types of hoagies it sells. The manager selects a week at random and records the number of hoagies of each type that the store sold. At a 0.01, is there a preference in the type of hoagies sold? Use the critical value method with The Chi-Square Distribution Table. Italian 74 Steak 52 Meatball 88 Vegetable 86 Send data to Excel Part: 0/5 Part 1 of 5 (a) Identify the claim with the correct hypothesis. Ho: Customers don't show a preference in the type of hoagie ordered. (Choose one) H₁: Customers show a preference in the type of hoagie ordered. (Choose one) x G Part: 1/5 Part 2 of 5 (b) Find the critical value. Use The Chi-Square Distribution Table. Round the answer to at least three decimal places. The critical value is Part: 2/5 Part 3 of 5 (c) Compute the test statistic. Round the intermediate and final answers to at least three decimal places. 2-1 Start over Part: 3/5 Part 4 of 5 (d) Make the decision. (Choose…arrow_forward8 19 10 11 12 13 14 15 16 Physical Therapy A random sample of 10 physical therapy patients who had knee surgery shows the angle of knee bend before physical therapy and after 6 weeks of physical therapy. At a 0.10, has there been an increase in the angle range after the therapy? Assume that all variables are normally distributed; use μ, for the "before" values and "D"₁₂. Use the critical value method and tables. Patient 1 2 3 4 S 6 7 8 9 10 Degrees before 81 84 91 66 67 92 90 93 87 62 Degrees after 120 125 129 104 106 122 119 126 115 136 Send data to Excel Part: 0/5 Part 1 of 5 (a) State the hypotheses and identify the claim. Ho (Choose one) H₁: (Choose one) This hypothesis test is a (Choose one) test. 0<0 Darrow_forward8 Español 10 11 12 13 14 15 Disabling Injuries Is the type of injury related to the age of the individual at a=0.05? Type Motor vehicle Home Work Public Under 35 35 and 26 24 29 26 11 18 36 34 I over Send data to Excel Part: 0/5 Part 1 of 5 (a) State the hypotheses and identify the claim. Ho: The type of injury is (Choose one) age. (Choose one) X H₁: The type of injury is (Choose one) age. (Choose one) Part: 1/5 Part 2 of 5 (b) Find the critical value. Round the answer to at least three decimal places. Use The Chi-Square Distribution Table. Critical value- x Part: 2/5 Part 3 of 5 (c) Compute the test statistic. Round the intermediate and final answers to at least three decimal places. 7-0 x の Part: 3/5 Part 4 of 5 (d) Make the decision. (Choose one) the null hypothesis. Part: 4/5 20 F3 a F4 G Reserved. Terms of Use Submit Assignment Privacy Center | Accessibility F5 95 8 DII F6 F7 F8 F9 F10 TAarrow_forwardEspa 3 4 5 -6 7 8 9 10 11 1 Divorce Rates The number of years that first-time married couples stay together before they divorce is shown. If the sample is random and is 2.1, find the 99% confidence interval for the mean. Round your answers to one decimal place. S 3 1 4 11 8 9 3 12 6 10 5 3 2 7 9 11 6 3 5 S 7 8 9 6 4 10 6 2 Send data to Excelarrow_forward13 14 15 16 Physical Therapy A random sample of 10 physical therapy patients who had knee surgery shows the angle of knee bend before physical therapy and after 6 weeks of physical therapy. At a 0.05, has there been an increase in the angle range after Use the HD-1-2- the therapy? Assume that all variables are normally distributed; use ₁ for the "before" values and critical value method and tables. Patient I 2 3 4 5 6 7 8 9 10 Degrees before 89 63 95 74 76 67 69 78 92 68 Degrees after 102 141 118 114 122 137 121 129 116 104 Send data to Excel Part: 0/5 Part 1 of 5 (a) State the hypotheses and identify the claim. Ho (Choose one) H₁: (Choose one) This hypothesis test is a (Choose one) test. 0>0 0<0 0x0 HD ローロ G Part: 1/5 Part 2 of 5 (b) Find the critical value(s). Round the answer(s) to at least three decimal places. If there is more than one critical value, separate them with comma Critical value(s): DO × G Part: 2/5 Part 3 of 5 (c) Compute the test statistic. Round Intermediate…arrow_forwardCigarette Smoking A researcher found that a cigarette smoker smokes on average 30 cigarettes a day. She feels that this average is too low. She selected a random sample of 8 smokers and found that the mean number of cigarettes they smoked per day was 32. The sample standard deviation was 2.8. At a 0.05, is there enough evidence to support her claim? Assume that the population is approximately normally distributed. Use the critical value method and tables. Part: 0/5 Part 1 of 5 (a) State the hypotheses and identify the claim. Ho H₁ (Choose one) (Choose one) This hypothesis test is a (Choose one) test. μ ロロ 0<0 ローロ O-O G Part: 1/5 C Part 2 of 5 (b) Find the critical value(s). Round the answer to three decimal places. If there is more than one critical value, seperate them with commas. Critical value(s): x Part: 2/5 Part 3 of 5 (c) Compute the test value. Always round r score values to three decimal places. 1 80 x Part: 3/5 Part 4 of 5 (d) Make the decision. (Choose one) the null…arrow_forwardEspañ 13 14 15 16 17 18 19 20 21 Essays A professor wishes to see if two groups of students' essays differ in lengths, that is, the number of words in each essay. The professor randomly selects 12 essays from a group of students who are science majors and 10 essays from a group of humanities majors to compare. The data are shown. Find the 99% confidence interval for the difference of the means. Assume the variables are normally distributed and the variances are unequal. Round the answers to at least one decimal place. Science majors Humanities majors 2299 3140 2409 3432 2708 1698 2699 1756 2161 5000 1960 2935 3998 3352 1599 3839 3694 2319 2043 2979 2282 2758 Send data to Excel Use MI for the mean length of the science majors' essays. << 20 F3 Continue G Submit Assignment a Å DII F4 F5 F6 F7 F8 중요 F9 F10arrow_forwardTeachers' Salaries California and New York lead the list of average teachers' salaries. The California yearly average is $65,493 while teachers in New York make an annual salary of $62,773. Random samples of 45 teachers from each state yielded the following. Sample mean Population standard California New York 65,493 62,773 8142 7821 Es deviation Send data to Excel Use #1 for the average teachers' salaries in California. At a 0.01, is there a difference in means of the salaries? Part: 0/5 Part 1 of 5 (a) State the hypotheses and identify the claim. Ho (Choose one) H₁(Choose one) This hypothesis test is a (Choose one) test. 0<0 0<0 ローロ H2 Part: 1/5 Part 2 of 5 (b) Find the critical value(s). Round the answer(s) to at least two decimal places. If there is more than one critical value, separate them with commas. Critical value(s): Part: 2/5 Part 3 of 5 (c) Compute the test value. Round the answer to at least two decimal places. Part: 3/5 Part 4 of 5 X (d) Make the decision. Continue Submit…arrow_forwardarrow_back_iosSEE MORE QUESTIONSarrow_forward_iosRecommended textbooks for you
- Big Ideas Math A Bridge To Success Algebra 1: Stu...AlgebraISBN:9781680331141Author:HOUGHTON MIFFLIN HARCOURTPublisher:Houghton Mifflin HarcourtGlencoe Algebra 1, Student Edition, 9780079039897...AlgebraISBN:9780079039897Author:CarterPublisher:McGraw HillHolt Mcdougal Larson Pre-algebra: Student Edition...AlgebraISBN:9780547587776Author:HOLT MCDOUGALPublisher:HOLT MCDOUGAL
Big Ideas Math A Bridge To Success Algebra 1: Stu...AlgebraISBN:9781680331141Author:HOUGHTON MIFFLIN HARCOURTPublisher:Houghton Mifflin HarcourtGlencoe Algebra 1, Student Edition, 9780079039897...AlgebraISBN:9780079039897Author:CarterPublisher:McGraw HillHolt Mcdougal Larson Pre-algebra: Student Edition...AlgebraISBN:9780547587776Author:HOLT MCDOUGALPublisher:HOLT MCDOUGAL