
Concept explainers
Videos
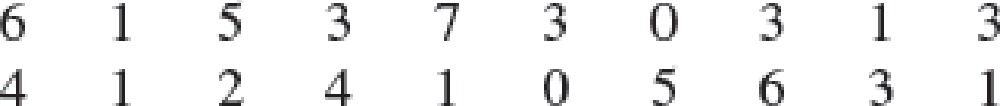
Americans Dining Out. Americans tend to dine out multiple times per week. The number of times a sample of 20 families dined out last week provides the following data.
- a. Compute the mean and median.
- b. Compute the first and third
quartiles . - c. Compute the
range andinterquartile range . - d. Compute the variance and standard deviation.
- e. The skewness measure for these data is .34. Comment on the shape of this distribution. Is it the shape you would expect? Why or why not?
- f. Do the data contain outliers?
a.
Find the mean and median.
Answer to Problem 62SE
The mean and median are 2.95 and 3, respectively.
Explanation of Solution
Calculation:
The data represent the number of times a family dined out last week for a sample of 20 families.
Descriptive measures:
Software procedure:
Step by step procedure to obtain the descriptive statistics using EXCEL is as follows:
- In an EXCEL sheet enter the data values of the sample and label it as Sample.
- Go to Data > Data Analysis (in case it is not default, take the Analysis ToolPak from Excel Add Ins) > Descriptive statistics.
- Enter Input Range as $A$2:$A$21, select Columns in Grouped By, tick on Summary statistics.
- Click on OK.
Output using EXCEL is given as follows:
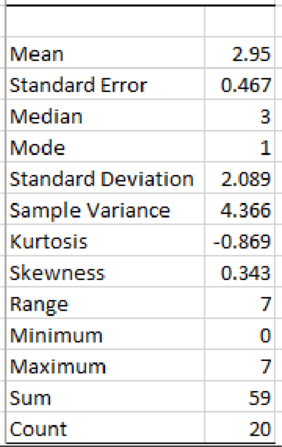
From the EXCEL output, the mean and median number of crossing for these ports of entry are 2.95 and 3, respectively.
Thus, the mean and median are 2.95, and 3, respectively.
b.
Find the first and third quartiles.
Answer to Problem 62SE
The first and third quartiles of the dataset are 1 and 4.75, respectively.
Explanation of Solution
Calculation:
First quartile:
The EXCEL function to compute first quartile is
Software Procedure:
Step by step procedure to obtain the first quartile using EXCEL is as follows:
- Open an EXCEL file.
- Enter the data in the column A in cells A2 to A21.
- In a cell, enter the formula QUARTILE.EXC (A2:A21,1).
- Click on OK.
Output using EXCEL is given as follows:
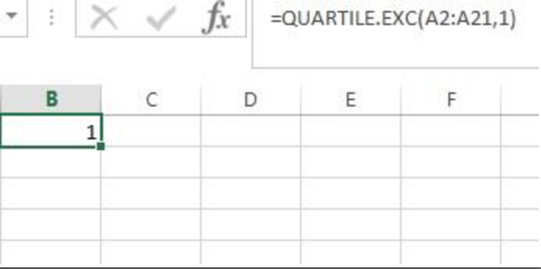
From the EXCEL output, the first quartile of the sample data is 1.
Third quartile:
The EXCEL function to compute third quartile is
Software Procedure:
Step by step procedure to obtain the third quartile using EXCEL is as follows:
- Open an EXCEL file.
- Enter the data in the column A in cells A2 to A21.
- In a cell, enter the formula QUARTILE.EXC (A2:A21,3).
- Click on OK.
Output using EXCEL is given as follows:
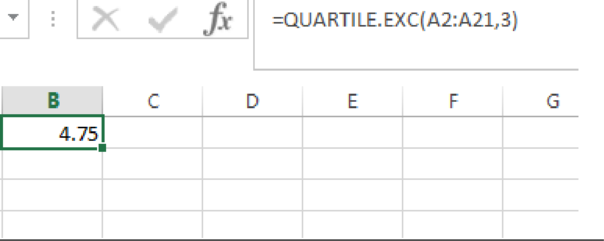
From the EXCEL output, the third quartile of the sample data is 4.75.
Thus, the first and third quartiles are 1 and 4.75, respectively.
c.
Find the range and interquartile range.
Answer to Problem 62SE
The range and interquartile range are 7 and 3.75, respectively.
Explanation of Solution
Calculation:
From the EXCEL output obtained in Part (a), the range of the dataset is 7.
From the answers obtained in Part (b), the first and third quartiles of the dataset are 1 and 4.75, respectively.
The IQR can be obtained as follows:
Substitute
Thus, the IQR is 3.75.
Hence, the range, and interquartile range of the dataset are 7, and 3.75, respectively.
d.
Find the variance and standard deviation.
Answer to Problem 62SE
The variance and standard deviation of the dataset are 4.366 and 2.089, respectively.
Explanation of Solution
Calculation:
From the EXCEL output obtained in Part (a), the variance and standard deviation of the dataset are 4.366 and 2.089, respectively.
Thus, the variance and standard deviation of the dataset are 4.366 and 2.089, respectively.
e.
Comment on the shape of the distribution of the given dataset.
Explain whether or not the obtained shape is expected shape.
Explanation of Solution
Given that, the skewness measure for the data is 0.34.
Skewness:
- If the value of skewness is equal to zero, then the distribution is symmetric.
- If the skewness value is less than zero, then the distribution is negatively skewed
- If the skewness value is greater than zero, then the distribution is positively skewed.
Here, the measure of skewness is 0.34.
Since, the measure of skewness is greater than zero, the shape of the distribution is said to be positively skewed.
f.
Check whether the data contain any outliers.
Answer to Problem 62SE
The data has no outliers.
Explanation of Solution
Calculation:
Outliers:
The outlier is the observational point that is distant from the remaining observational points. In other words, outlier is an observation that lies in an abnormal distance from the remaining values.
The outlier in the dataset is identified using the following calculation.
The formula for lower limit is given below:
Here,
Substitute
Thus, the lower limit is –4.625.
The formula for upper limit is given below:
Substitute
Thus, the upper limit is 10.375.
In the present scenario, the data points that are less than lower limit (–4.625) and the data points that are greater than upper limit (10.375) are considered as outliers.
Here, none of the data points are less than the lower limit (–4.625) and none of the data points are greater than upper limit (10.375).
Since, all the data values lie within the limits.
Thus, the dataset does not contain any outliers.
Want to see more full solutions like this?
Chapter 3 Solutions
Essentials Of Statistics For Business & Economics


 Glencoe Algebra 1, Student Edition, 9780079039897...AlgebraISBN:9780079039897Author:CarterPublisher:McGraw Hill