
Essentials Of Statistics For Business & Economics
9th Edition
ISBN: 9780357045435
Author: David R. Anderson, Dennis J. Sweeney, Thomas A. Williams, Jeffrey D. Camm, James J. Cochran
Publisher: South-Western College Pub
expand_more
expand_more
format_list_bulleted
Videos
Textbook Question
Chapter 3.1, Problem 18E
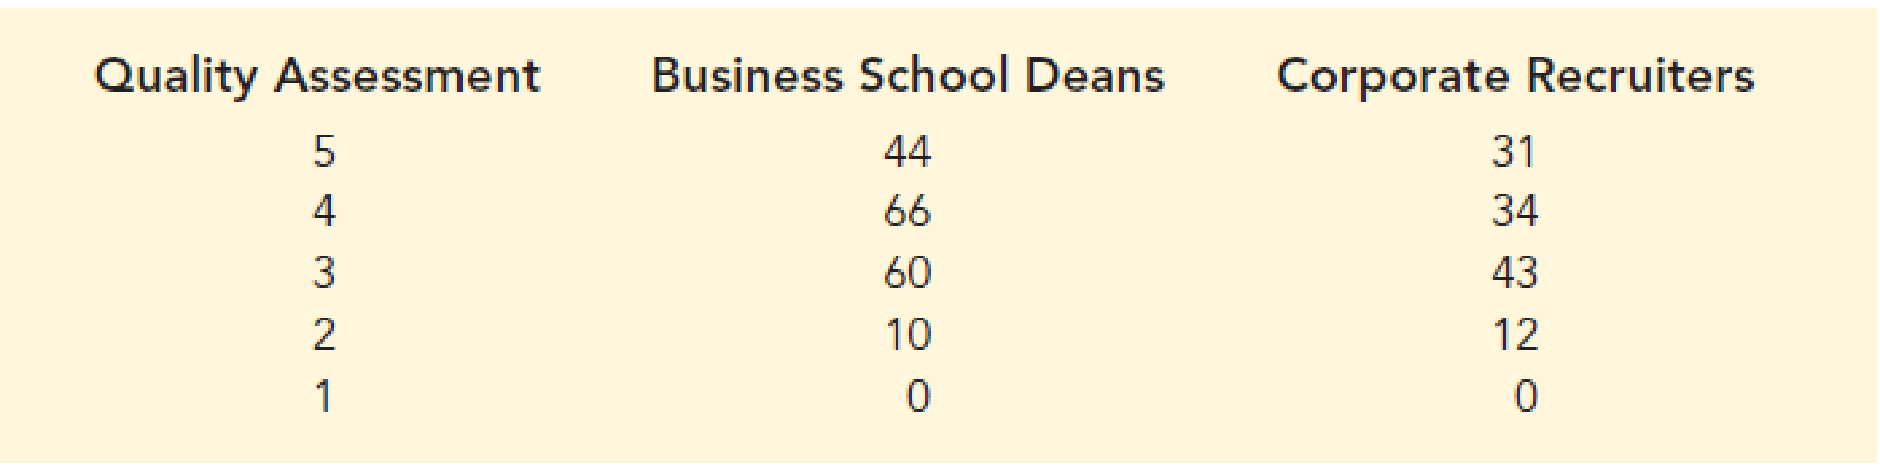
Business School Ranking. Based on a survey of master’s programs in business administration, magazines such as U.S. News & World Report rank U.S. business schools. These types of rankings are based in part on surveys of business school deans and corporate recruiters. Each survey respondent is asked to rate the overall academic quality of the master’s program on a scale from 1 “marginal” to 5 “outstanding.” Use the sample of responses shown below to compute the weighted mean score for the business school deans and the corporate recruiters. Discuss.
Expert Solution & Answer
Want to see the full answer?
Check out a sample textbook solution
Chapter 3 Solutions
Essentials Of Statistics For Business & Economics
Ch. 3.1 - Consider a sample with data values of 10, 20, 12,...Ch. 3.1 - Consider a sample with data values of 10, 20, 21,...Ch. 3.1 - Consider the following data and corresponding...Ch. 3.1 - Consider the following data.
What is the mean...Ch. 3.1 - Consider a sample with data values of 27, 25, 20,...Ch. 3.1 - Consider a sample with data values of 53, 55, 70,...Ch. 3.1 - eICU Waiting Times. There is a severe shortage of...Ch. 3.1 - Middle-Level Manager Salaries. Suppose that an...Ch. 3.1 - Advertising Spending. Which companies spend the...Ch. 3.1 - Advertising Spending. Which companies spend the...
Ch. 3.1 - Time Spent Watching Traditional TV. Nielsen tracks...Ch. 3.1 - Online Multiplayer Game Downloads. The creator of...Ch. 3.1 - Automobile Fuel Efficiencies. In automobile...Ch. 3.1 - Unemployment Rates by State. The U.S. Bureau of...Ch. 3.1 - Motor Oil Prices. Martinez Auto Supplies has...Ch. 3.1 - Calculating Grade Point Averages. The grade point...Ch. 3.1 - The following table shows the total return and the...Ch. 3.1 - Business School Ranking. Based on a survey of...Ch. 3.1 - Revenue Growth Rate. Annual revenue for Corning...Ch. 3.1 - Mutual Fund Comparison. Suppose that at the...Ch. 3.1 - If an asset declines in value from $5000 to $3500...Ch. 3.1 - The current value of a company is 25 million. If...Ch. 3.2 - Consider a sample with data values of 10, 20, 12,...Ch. 3.2 - Consider a sample with data values of 10, 20, 12,...Ch. 3.2 - Consider a sample with data values of 27, 25, 20,...Ch. 3.2 - Price of Unleaded Gasoline. Data collected by the...Ch. 3.2 - Round-Trip Flight Prices. The following table...Ch. 3.2 - Annual Sales Amounts. Varatta Enterprises sells...Ch. 3.2 - Air Quality Index. The Los Angeles Times regularly...Ch. 3.2 - Prob. 30ECh. 3.2 - Cellular Phone Spending. According to the 2016...Ch. 3.2 - Advertising Spend by Companies. Advertising Age...Ch. 3.2 - Amateur Golfer Scores. Scores turned in by an...Ch. 3.2 - Consistency of Running Times. The following times...Ch. 3.3 - Consider a sample with data values of 10, 20, 12,...Ch. 3.3 - Prob. 36ECh. 3.3 - Consider a sample with a mean of 30 and a standard...Ch. 3.3 - Suppose the data have a bell-shaped distribution...Ch. 3.3 - The results of a national survey showed that on...Ch. 3.3 - Price per Gallon of Gasoline. Suppose that the...Ch. 3.3 - GMAT Exam Scores. The Graduate Management...Ch. 3.3 - Many families in California are using backyard...Ch. 3.3 - Best Places to Live. Each year Money magazine...Ch. 3.3 - NCAA Basketball Game Scores. A sample of 10 NCAA...Ch. 3.3 - Prob. 45ECh. 3.4 - Consider a sample with data values of 27, 25, 20,...Ch. 3.4 - Show the boxplot for the data in exercise 46. 46....Ch. 3.4 - Prob. 48ECh. 3.4 - Prob. 49ECh. 3.4 - Naples Half-Marathon Times. Naples, Florida, hosts...Ch. 3.4 - Pharmaceutical Company Sales. Annual sales, in...Ch. 3.4 - Cell Phone Companies Customer Satisfaction....Ch. 3.4 - Most Admired Companies. Fortune magazines list of...Ch. 3.4 - U.S. Border Crossings. The Bureau of...Ch. 3.5 - Five observations taken for two variables follow....Ch. 3.5 - Five observations taken for two variables follow....Ch. 3.5 - Stock Price Comparison. The file StockComparison...Ch. 3.5 - Driving Speed and Fuel Efficiency. A department of...Ch. 3.5 - Smoke Detector Use and Death Rates. Over the past...Ch. 3.5 - Stock Market Indexes Comparison. The Russell 1000...Ch. 3.5 - Best Private Colleges. A random sample of 30...Ch. 3 - Americans Dining Out. Americans tend to dine out...Ch. 3 - NCAA Football Coaches Salaries. A 2017 USA Today...Ch. 3 - Physician Office Waiting Times. The average...Ch. 3 - Worker Productivity and Insomnia. U.S. companies...Ch. 3 - Work Commuting Methods. Public transportation and...Ch. 3 - Household Incomes. The following data represent a...Ch. 3 - Prob. 69SECh. 3 - Best Hotels. Travel + Leisure magazine provides an...Ch. 3 - NFL Teams Worth. In 2014, the 32 teams in the...Ch. 3 - MLB Team Winning Percentages. Does a major league...Ch. 3 - Money Market Funds Days to Maturity. The days to...Ch. 3 - Automobile Speeds. Automobiles traveling on a road...Ch. 3 - Annual Returns for Panama Railroad Company Stock....Ch. 3 - Pelican Stores, a division of National Clothing,...Ch. 3 - Prob. 2CPCh. 3 - The pursuit of a higher education degree in...Ch. 3 - Although millions of elephants once roamed across...
Knowledge Booster


Learn more about
Need a deep-dive on the concept behind this application? Look no further. Learn more about this topic, statistics and related others by exploring similar questions and additional content below.Recommended textbooks for you
 Linear Algebra: A Modern IntroductionAlgebraISBN:9781285463247Author:David PoolePublisher:Cengage Learning
 Functions and Change: A Modeling Approach to Coll...AlgebraISBN:9781337111348Author:Bruce Crauder, Benny Evans, Alan NoellPublisher:Cengage Learning
 Big Ideas Math A Bridge To Success Algebra 1: Stu...AlgebraISBN:9781680331141Author:HOUGHTON MIFFLIN HARCOURTPublisher:Houghton Mifflin Harcourt
 Glencoe Algebra 1, Student Edition, 9780079039897...AlgebraISBN:9780079039897Author:CarterPublisher:McGraw Hill
Linear Algebra: A Modern Introduction
Algebra
ISBN:9781285463247
Author:David Poole
Publisher:Cengage Learning
Functions and Change: A Modeling Approach to Coll...
Algebra
ISBN:9781337111348
Author:Bruce Crauder, Benny Evans, Alan Noell
Publisher:Cengage Learning
Big Ideas Math A Bridge To Success Algebra 1: Stu...
Algebra
ISBN:9781680331141
Author:HOUGHTON MIFFLIN HARCOURT
Publisher:Houghton Mifflin Harcourt
Glencoe Algebra 1, Student Edition, 9780079039897...
Algebra
ISBN:9780079039897
Author:Carter
Publisher:McGraw Hill
How to make Frequency Distribution Table / Tally Marks and Frequency Distribution Table; Author: Reenu Math;https://www.youtube.com/watch?v=i_A6RiE8tLE;License: Standard YouTube License, CC-BY
Frequency distribution table in statistics; Author: Math and Science;https://www.youtube.com/watch?v=T7KYO76DoOE;License: Standard YouTube License, CC-BY
Frequency Distribution Table for Grouped/Continuous data | Math Dot Com; Author: Maths dotcom;https://www.youtube.com/watch?v=ErnccbXQOPY;License: Standard Youtube License