
Concept explainers
Videos
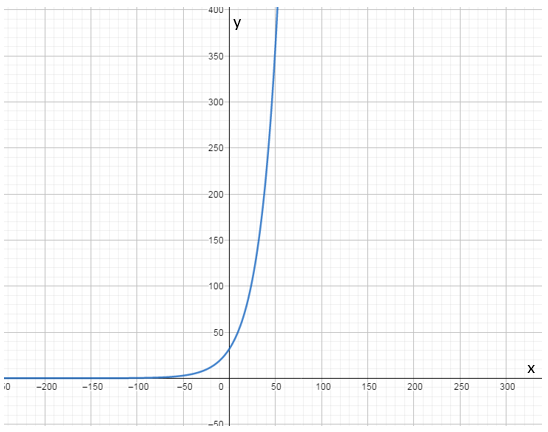
a.
To graph the function for the year
a.
Explanation of Solution
Given information:
The given statement is:
“The projected populations of American ages
Graph:
: Sketch the graph using graphing utility.
Step 1: Press WINDOW button to access the Window editor.
Step 2: Press
Step 3: Enter the expression
Step 4: Press GRAPH button to graph the function.
The graph is obtained as:
b.
To create a table of the values for the years
b.
Answer to Problem 77E
The tables of the values are:


Explanation of Solution
Given information:
The given statement is:
“The projected populations of American ages
Calculation:
The tables of the values are:


c.
To find the year in which the population will exceed
c.
Answer to Problem 77E
The population will exceed
Explanation of Solution
Given information:
The given statement is:
“The projected populations of American ages
According to the table of values, the population will exceed
Chapter 3 Solutions
PRECALCULUS W/LIMITS:GRAPH.APPROACH(HS)


 Calculus: Early TranscendentalsCalculusISBN:9781285741550Author:James StewartPublisher:Cengage Learning
 Thomas' Calculus (14th Edition)CalculusISBN:9780134438986Author:Joel R. Hass, Christopher E. Heil, Maurice D. WeirPublisher:PEARSON
 Calculus: Early Transcendentals (3rd Edition)CalculusISBN:9780134763644Author:William L. Briggs, Lyle Cochran, Bernard Gillett, Eric SchulzPublisher:PEARSON
 Calculus: Early TranscendentalsCalculusISBN:9781319050740Author:Jon Rogawski, Colin Adams, Robert FranzosaPublisher:W. H. Freeman
 Calculus: Early Transcendental FunctionsCalculusISBN:9781337552516Author:Ron Larson, Bruce H. EdwardsPublisher:Cengage Learning