
Concept explainers
Videos
(a)
To Explain: the mean and median to be larger expected.
(a)
Explanation of Solution
Given:

When the distribution is positively or right skewed the relation between mean, median and
Mean > Median > Mode
For the negatively or left skewed the relation should be
Mean < Median < Mode
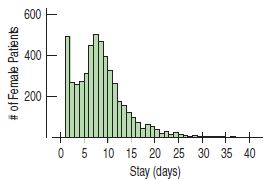
By seeing the distribution, it is shows that the distribution is right skewed because the large tail looks on the right side of the distribution. So for the positively skewed distribution or right side skewed distribution, mean is greater than median. Hence the histogram would expect the mean to be larger.
(b)
To Explain: the few sentences describing this distribution.
(b)
Explanation of Solution
Given:

By seeing the histogram, there are two peaks in the histogram one is at 1 and another is at 8 days. So the distribution is bimodal and skewed to right. On the basis of the height of the bars in the histogram, most of the patient stays in between 1 and 15 and there are some extreme values above 25 days.
(c)
To Explain: the summary statistics would choose to summarize the centre and spread in these data.
(c)
Explanation of Solution
Given:
By seeing the distribution, the data is skewed. Mean and Inter
Chapter 4 Solutions
Stats: Modeling the World Nasta Edition Grades 9-12
Additional Math Textbook Solutions
Statistics: The Art and Science of Learning from Data (4th Edition)
Statistics for Business and Economics (13th Edition)
Introductory Statistics (2nd Edition)
Fundamentals of Statistics (5th Edition)
Introductory Statistics
Elementary Statistics: Picturing the World (7th Edition)


 MATLAB: An Introduction with ApplicationsStatisticsISBN:9781119256830Author:Amos GilatPublisher:John Wiley & Sons Inc
 Probability and Statistics for Engineering and th...StatisticsISBN:9781305251809Author:Jay L. DevorePublisher:Cengage Learning
 Statistics for The Behavioral Sciences (MindTap C...StatisticsISBN:9781305504912Author:Frederick J Gravetter, Larry B. WallnauPublisher:Cengage Learning
 Elementary Statistics: Picturing the World (7th E...StatisticsISBN:9780134683416Author:Ron Larson, Betsy FarberPublisher:PEARSON
 The Basic Practice of StatisticsStatisticsISBN:9781319042578Author:David S. Moore, William I. Notz, Michael A. FlignerPublisher:W. H. Freeman
 Introduction to the Practice of StatisticsStatisticsISBN:9781319013387Author:David S. Moore, George P. McCabe, Bruce A. CraigPublisher:W. H. Freeman