
Concept explainers
Videos
(a)
To find: the measure of centre and spread are the most appropriate.
(a)
Explanation of Solution
Given:

State populations (1|2 means 12 million)
By seeing the stem plot, it is observed that there is not symmetric and it is skewed to right. Therefore the best measure of centre is by median and with median the best measure of spread is inter
(b)
To find: the larger the median or mean.
(b)
Explanation of Solution
Given:

By seeing the distribution, it is observed that the distribution is skewed to right then the mean is greater than median and if the distribution is left skewed then the mean is smaller than the median. This is highly skewed to right distribution so the mean is larger than the median. For the skewed distribution the median is more suitable than mean.
(c)
To find: the median and the inter
(c)
Explanation of Solution
Given:

Middle value of the ordered data in known as median and 51 is the total number of states so the median would be (50/2+1=26th value) by seeing the stem plot 26th value is 4 million so the median is 4 million.
Middle value of lower half of the data set is lower quartile and the upper quartile is the middle value of upper half of data set.
For the lower half of the data is 26. Average value of 13th position which is 1 million and 14th position which is 2 million of lower half of the data list is lower quartile.
Similarly for upper half
So the inter quartile range is 4.5 million
(d)
To Explain: the distribution few sentences.
(d)
Explanation of Solution
Given:
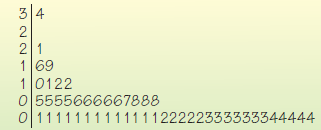
By seeing the stem plot, it seems that the distribution is not symmetric. It is skewed to right, unimodal and
Chapter 4 Solutions
Stats: Modeling the World Nasta Edition Grades 9-12
Additional Math Textbook Solutions
Essentials of Statistics, Books a la Carte Edition (5th Edition)
Intro Stats, Books a la Carte Edition (5th Edition)
Elementary Statistics
Statistics for Business and Economics (13th Edition)
Basic Business Statistics, Student Value Edition (13th Edition)


 MATLAB: An Introduction with ApplicationsStatisticsISBN:9781119256830Author:Amos GilatPublisher:John Wiley & Sons Inc
 Probability and Statistics for Engineering and th...StatisticsISBN:9781305251809Author:Jay L. DevorePublisher:Cengage Learning
 Statistics for The Behavioral Sciences (MindTap C...StatisticsISBN:9781305504912Author:Frederick J Gravetter, Larry B. WallnauPublisher:Cengage Learning
 Elementary Statistics: Picturing the World (7th E...StatisticsISBN:9780134683416Author:Ron Larson, Betsy FarberPublisher:PEARSON
 The Basic Practice of StatisticsStatisticsISBN:9781319042578Author:David S. Moore, William I. Notz, Michael A. FlignerPublisher:W. H. Freeman
 Introduction to the Practice of StatisticsStatisticsISBN:9781319013387Author:David S. Moore, George P. McCabe, Bruce A. CraigPublisher:W. H. Freeman