
Concept explainers
Videos
(a)
To construct: the stem and leaf plot on the basis of given data
(a)
Explanation of Solution
Given:
2.22, 2.27, 2.26, 2.36, 2.21, 2.28, 2.46, 2.38, 2.45, 2.27, 2.29, 2.33, 2.24, 2.23, 2.32, 2.27
Graph:
Stem unit = 0.1
Leaf unit = 0.001
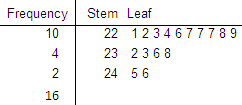
By seeing the stem plot, it is observed that the distribution appears not symmetric. It is skewed to right and unimodal. There is an outlier and only few stations have higher prices.
(b)
To Explain: the shape, centre and spread of this distribution.
(b)
Explanation of Solution
The shape is skewed to the right since there are more numbers on the left than on the right. The centre is $2.275 if there are using the median as the measure of centre (here, the median is average of the 8th and 9th numbers, which are $2.27 and $2.28. respectively). The spread is $0.25 if there are using the
(c)
To find: the unusual feature.
(c)
Explanation of Solution
One outlier in the distribution which displays that the prices of two gas stations are higher than prices of other gas stations. Between two gas stations there is a gap.
Chapter 4 Solutions
Stats: Modeling the World Nasta Edition Grades 9-12
Additional Math Textbook Solutions
Elementary Statistics (13th Edition)
Statistics: The Art and Science of Learning from Data (4th Edition)
Basic Business Statistics, Student Value Edition (13th Edition)
Essentials of Statistics, Books a la Carte Edition (5th Edition)
Intro Stats
Essentials of Statistics (6th Edition)


 MATLAB: An Introduction with ApplicationsStatisticsISBN:9781119256830Author:Amos GilatPublisher:John Wiley & Sons Inc
 Probability and Statistics for Engineering and th...StatisticsISBN:9781305251809Author:Jay L. DevorePublisher:Cengage Learning
 Statistics for The Behavioral Sciences (MindTap C...StatisticsISBN:9781305504912Author:Frederick J Gravetter, Larry B. WallnauPublisher:Cengage Learning
 Elementary Statistics: Picturing the World (7th E...StatisticsISBN:9780134683416Author:Ron Larson, Betsy FarberPublisher:PEARSON
 The Basic Practice of StatisticsStatisticsISBN:9781319042578Author:David S. Moore, William I. Notz, Michael A. FlignerPublisher:W. H. Freeman
 Introduction to the Practice of StatisticsStatisticsISBN:9781319013387Author:David S. Moore, George P. McCabe, Bruce A. CraigPublisher:W. H. Freeman