
Concept explainers
Videos
(a)
To construct: a suitable display for the growth rates.
(a)
Explanation of Solution
Given:

Graph:
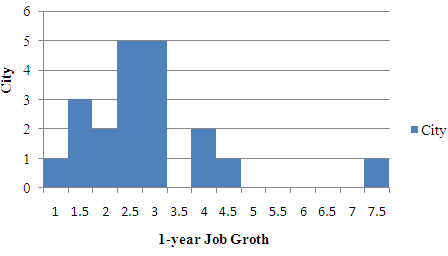
By seeing the data, it is observed that the data is quantitative so the histogram is the appropriate to display the data. On the basis of given data plot the histogram.
(b)
To find: the summary the growth rate among these cities with a median and mean.
(b)
Explanation of Solution
Given:

Formula used:
Calculation:
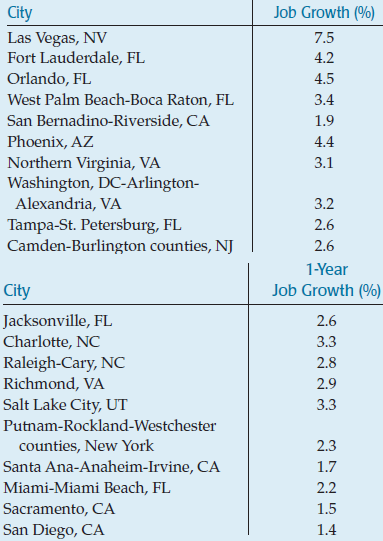
Arranging in the ascending order
1.4, 1.5, 1.7, 1.9, 2.2, 2.3, 2.6, 2.6, 2.6, 2.8, 2.9, 3.1, 3.2, 3.3, 3.3, 3.4, 4.2, 4.4, 4.5, 7.5 (in percent)
These are 20 values so median is the average of 10th and 11th values. therefore median would be
Sum of all the job growth percentages is 61.4% so mean would be
Hence, median is 2.85% and mean is 3.1%. Distribution is skewed to right so mean is higher than median.
(c)
To find: the better job of summarizing the growth rates.
(c)
Answer to Problem 48E
Median is better
Explanation of Solution
Median would be better than mean because the distribution is skewed to right. The distribution has outliers’ therefore median works better to explain the growth rates of job.
(d)
To find: the summary of the spread of the growth rate distribution with a standard deviation and with an IQR.
(d)
Answer to Problem 48E
Standard deviation of the distribution is 1.4% and IQR is 1.1%.
Explanation of Solution
Given:
Formula used:
Calculation:
So standard deviation will be
So standard deviation is 1.4%.
To find IQR let us first find
Lower half of data has 10 values. Lower half of data is
1.4, 1.5, 1.7, 1.9, 2.2, 2.3, 2.6, 2.6, 2.6, 2.6, 2.8
So the lower quartile is
Upper half of data has 10 values. Upper half of data is
2.9, 3.1, 3.2, 3.3, 3.3, 3.4, 4.2, 4.4, 4.5, 7.5
So the lower quartile is
Therefore IQR is
Hence, standard deviation of the distribution is 1.4% and IQR is 1.1%.
(e)
To find: the measures in (d) the better job of summarizing the growth rates.
(e)
Explanation of Solution
Inter
(f)
To find: the change the values of the summary statistics calculated above.
(f)
Explanation of Solution
Suppose first median, Subtracting 1.20% from every value of data does not change the order of data vales. Therefore the median would also be decrease by 1.20%. Therefore the new median would be 2.85% - 1.20% = 1.65%.
Now taking the standard deviation, Mean decreases by 1.20% and every value also decreases by 1.20% so deviation would not change. Therefore standard deviation remains unchanged.
Therefore, new standard deviation is 1.4%.
Lower and upper
(g)
To Explain: the expected the mean, median, standard deviation and IQR to change.
(g)
Explanation of Solution
1.4, 1.5, 1.7, 1.9, 2.2, 2.3, 2.6, 2.6, 2.6, 2.8, 2.9, 3.1, 3.2, 3.3, 3.3, 3.4, 4.2, 4.4, 4.5
Total number of values is odd so median is the 10th value that is 2.8%.
So new mean is equal to 2.8%
Standard deviation decreases. Las Vegas job growth percentage works as an outlier in the distribution so omitting Las Vegas decreases standard deviation also.
Las Vegas value is last in order data set so omitting it does not change IQR.
(h)
To Explain: the report about all of these growth rates.
(h)
Explanation of Solution
The distribution is skewed to right and has an outlier so median shows the data correctly. Las Vegas job growth is significantly larger than any other city. Spread of the correctly represents by IQR. Almost 20 states have scores between 240 and 244. One of the state has scores less than 225.
Chapter 4 Solutions
Stats: Modeling the World Nasta Edition Grades 9-12
Additional Math Textbook Solutions
Elementary Statistics: Picturing the World (6th Edition)
Essentials of Statistics, Books a la Carte Edition (5th Edition)
Fundamentals of Statistics (5th Edition)
Basic Business Statistics, Student Value Edition
Statistics: The Art and Science of Learning from Data (4th Edition)


 MATLAB: An Introduction with ApplicationsStatisticsISBN:9781119256830Author:Amos GilatPublisher:John Wiley & Sons Inc
 Probability and Statistics for Engineering and th...StatisticsISBN:9781305251809Author:Jay L. DevorePublisher:Cengage Learning
 Statistics for The Behavioral Sciences (MindTap C...StatisticsISBN:9781305504912Author:Frederick J Gravetter, Larry B. WallnauPublisher:Cengage Learning
 Elementary Statistics: Picturing the World (7th E...StatisticsISBN:9780134683416Author:Ron Larson, Betsy FarberPublisher:PEARSON
 The Basic Practice of StatisticsStatisticsISBN:9781319042578Author:David S. Moore, William I. Notz, Michael A. FlignerPublisher:W. H. Freeman
 Introduction to the Practice of StatisticsStatisticsISBN:9781319013387Author:David S. Moore, George P. McCabe, Bruce A. CraigPublisher:W. H. Freeman