(a)
To find: the median and IQR.
(a)
Answer to Problem 30E
Median and IQR are 66 and 5 respectively.
Explanation of Solution
Given:
| Height | Count | Height | Count |
| 60 | 2 | 69 | 5 |
| 61 | 6 | 70 | 11 |
| 62 | 9 | 71 | 8 |
| 63 | 7 | 72 | 9 |
| 64 | 5 | 73 | 4 |
| 65 | 20 | 74 | 2 |
| 66 | 18 | 75 | 4 |
| 67 | 7 | 76 | 1 |
| 68 | 12 |
Formula used:
For the even number
Calculation:
Median is 66 inches
Every half of the data is having 65 values. Lower
Therefore the IQR would be 5
(b)
To find: the mean and standard deviation.
(b)
Answer to Problem 30E
Mean and standard deviation are 67 and 3.8 respectively.
Explanation of Solution
Given:
| Height | Count | Height | Count |
| 60 | 2 | 69 | 5 |
| 61 | 6 | 70 | 11 |
| 62 | 9 | 71 | 8 |
| 63 | 7 | 72 | 9 |
| 64 | 5 | 73 | 4 |
| 65 | 20 | 74 | 2 |
| 66 | 18 | 75 | 4 |
| 67 | 7 | 76 | 1 |
| 68 | 12 |
Formula used:
Calculation:
| Height (h) | Count (f) | f*h | f* | |
| 60 | 2 | 120 | 49 | 98 |
| 61 | 6 | 366 | 36 | 216 |
| 62 | 9 | 558 | 25 | 225 |
| 63 | 7 | 441 | 16 | 112 |
| 64 | 5 | 320 | 9 | 45 |
| 65 | 20 | 1300 | 4 | 80 |
| 66 | 18 | 1188 | 1 | 18 |
| 67 | 7 | 469 | 0 | 0 |
| 68 | 12 | 816 | 1 | 12 |
| 69 | 5 | 345 | 4 | 20 |
| 70 | 11 | 770 | 9 | 99 |
| 71 | 8 | 568 | 16 | 128 |
| 72 | 9 | 648 | 25 | 225 |
| 73 | 4 | 292 | 36 | 144 |
| 74 | 2 | 148 | 49 | 98 |
| 75 | 4 | 300 | 64 | 256 |
| 76 | 1 | 76 | 81 | 81 |
| Total | 130 | 8725 | 1857 |
For the standard deviation
Therefore the mean is 67 and standard deviation is 3.8
(c)
To construct: the histogram on the basis of given data.
(c)
Answer to Problem 30E
Skewed to right
Explanation of Solution
Given:
| Height | Count | Height | Count |
| 60 | 2 | 69 | 5 |
| 61 | 6 | 70 | 11 |
| 62 | 9 | 71 | 8 |
| 63 | 7 | 72 | 9 |
| 64 | 5 | 73 | 4 |
| 65 | 20 | 74 | 2 |
| 66 | 18 | 75 | 4 |
| 67 | 7 | 76 | 1 |
| 68 | 12 |
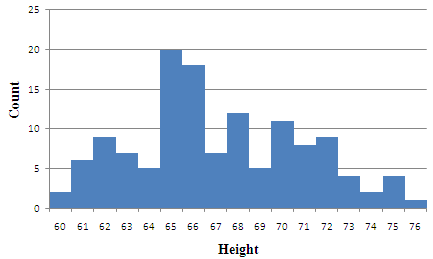
Graph:
Histogram on the basis of given data

By seeing the histogram, it is observed that skewed to right because the right tail is longer than the left.
(d)
To Explain: the distribution.
(d)
Explanation of Solution
The distribution is slightly skewed right the reason is that the right tail is longer than the left. Because median and IQR are unbiased whereas centre and standard deviation are they should be used as the measures for centre and spread instead in this case.
Chapter 4 Solutions
Stats: Modeling the World Nasta Edition Grades 9-12
Additional Math Textbook Solutions
Statistical Reasoning for Everyday Life (5th Edition)
Introductory Statistics
Elementary Statistics: Picturing the World (6th Edition)
Elementary Statistics (13th Edition)
 MATLAB: An Introduction with ApplicationsStatisticsISBN:9781119256830Author:Amos GilatPublisher:John Wiley & Sons Inc
 Probability and Statistics for Engineering and th...StatisticsISBN:9781305251809Author:Jay L. DevorePublisher:Cengage Learning
 Statistics for The Behavioral Sciences (MindTap C...StatisticsISBN:9781305504912Author:Frederick J Gravetter, Larry B. WallnauPublisher:Cengage Learning
 Elementary Statistics: Picturing the World (7th E...StatisticsISBN:9780134683416Author:Ron Larson, Betsy FarberPublisher:PEARSON
 The Basic Practice of StatisticsStatisticsISBN:9781319042578Author:David S. Moore, William I. Notz, Michael A. FlignerPublisher:W. H. Freeman
 Introduction to the Practice of StatisticsStatisticsISBN:9781319013387Author:David S. Moore, George P. McCabe, Bruce A. CraigPublisher:W. H. Freeman


