Videos
Agnew Manufacturing produces and sells three models of a single product, Standard, Superior, and DeLuxe, in a local market and in a regional market. At the end of the first quarter of the current year, the following income statement (in thousands of dollars) has been prepared:
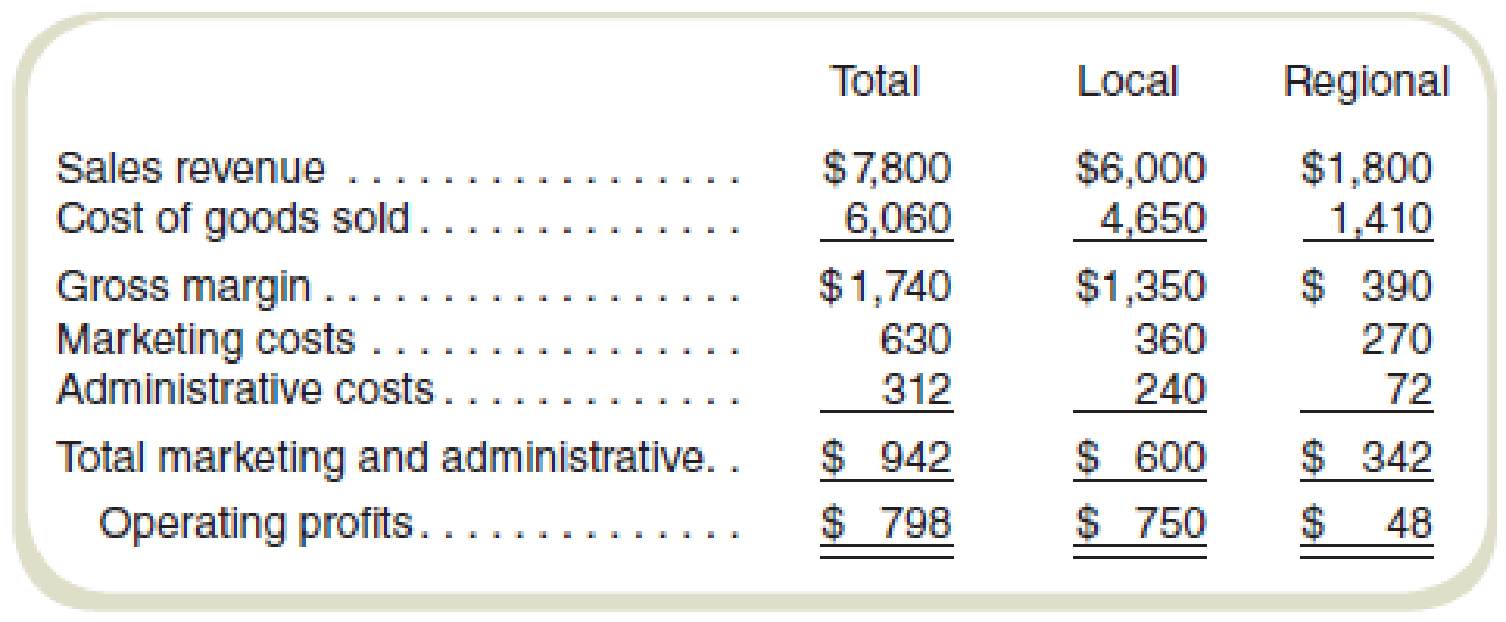
Management has expressed special concern with the regional market because of the extremely poor return on sales. This market was entered a year ago because of excess capacity. It was originally believed that the return on sales would improve with time, but after a year, no noticeable improvement can be seen from the results as reported in the preceding quarterly statement.
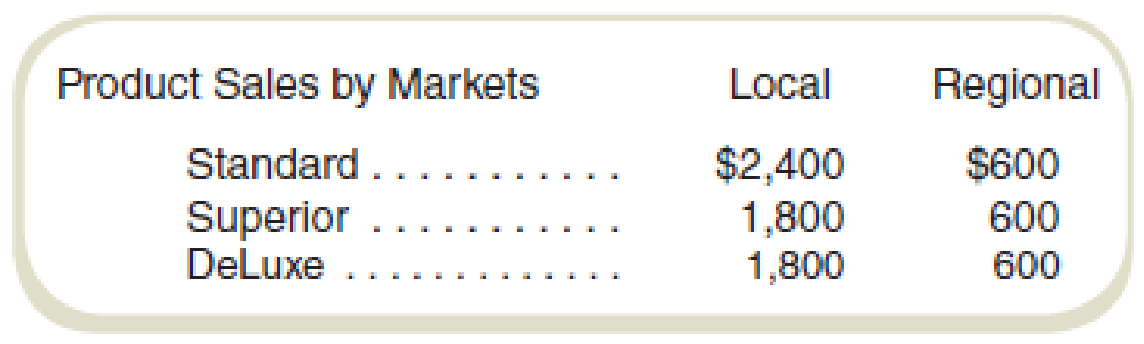
In attempting to decide whether to eliminate the regional market, the following information has been gathered:
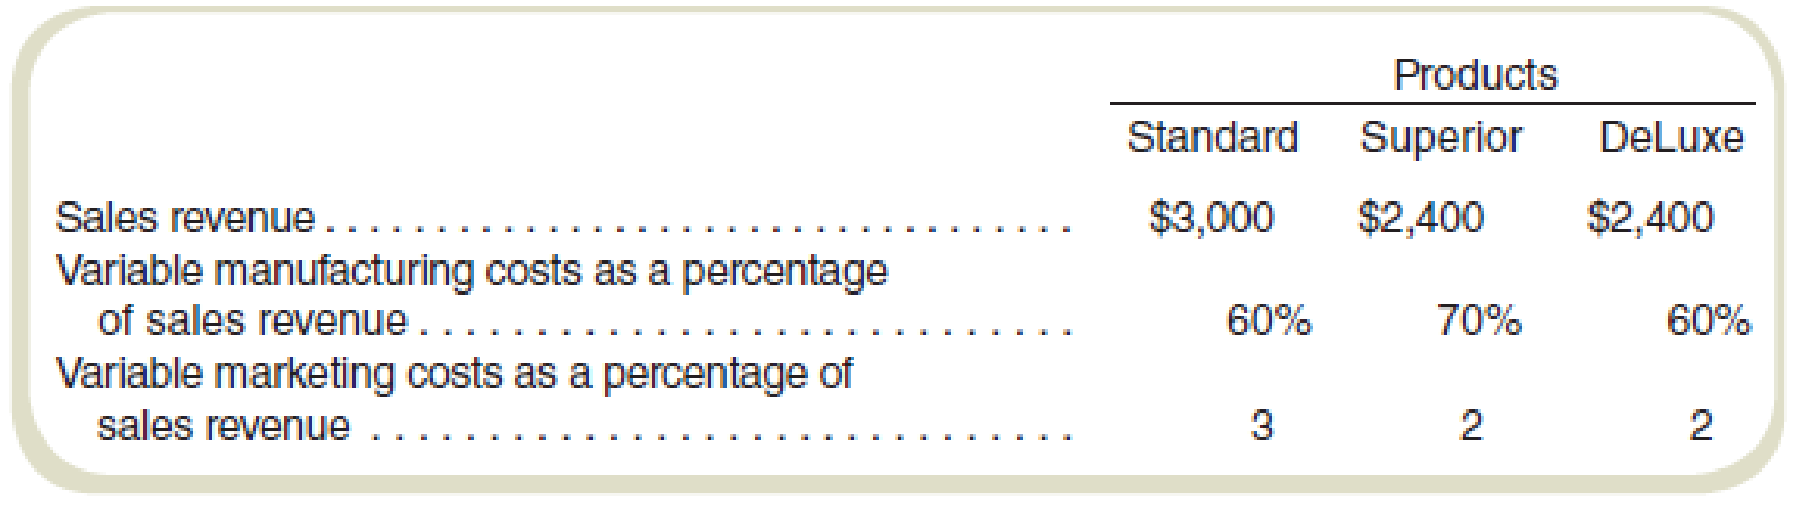
All administrative costs and fixed
Required
- a. Assuming there are no alternative uses for Agnew’s present capacity, would you recommend dropping the regional market? Why or why not?
- b. Prepare the quarterly income statement showing contribution margins by products. Do not allocate fixed costs to products.
- c. It is believed that a new model can be ready for sale next year if Agnew decides to go ahead with continued research. The new product would replace DeLuxe and can be produced by simply converting equipment presently used in producing the DeLuxe model. This conversion will increase fixed costs by $60,000 per quarter. What must be the minimum contribution margin per quarter for the new model to make the changeover financially feasible?
Want to see the full answer?
Check out a sample textbook solution
Chapter 4 Solutions
Fundamentals Of Cost Accounting (6th Edition)


- Nico Parts, Inc., produces electronic products with short life cycles (of less than two years). Development has to be rapid, and the profitability of the products is tied strongly to the ability to find designs that will keep production and logistics costs low. Recently, management has also decided that post-purchase costs are important in design decisions. Last month, a proposal for a new product was presented to management. The total market was projected at 200,000 units (for the two-year period). The proposed selling price was 130 per unit. At this price, market share was expected to be 25 percent. The manufacturing and logistics costs were estimated to be 120 per unit. Upon reviewing the projected figures, Brian Metcalf, president of Nico, called in his chief design engineer, Mark Williams, and his marketing manager, Cathy McCourt. The following conversation was recorded: BRIAN: Mark, as you know, we agreed that a profit of 15 per unit is needed for this new product. Also, as I look at the projected market share, 25 percent isnt acceptable. Total profits need to be increased. Cathy, what suggestions do you have? CATHY: Simple. Decrease the selling price to 125 and we expand our market share to 35 percent. To increase total profits, however, we need some cost reductions as well. BRIAN: Youre right. However, keep in mind that I do not want to earn a profit that is less than 15 per unit. MARK: Does that 15 per unit factor in preproduction costs? You know we have already spent 100,000 on developing this product. To lower costs will require more expenditure on development. BRIAN: Good point. No, the projected cost of 120 does not include the 100,000 we have already spent. I do want a design that will provide a 15-per-unit profit, including consideration of preproduction costs. CATHY: I might mention that post-purchase costs are important as well. The current design will impose about 10 per unit for using, maintaining, and disposing our product. Thats about the same as our competitors. If we can reduce that cost to about 5 per unit by designing a better product, we could probably capture about 50 percent of the market. I have just completed a marketing survey at Marks request and have found out that the current design has two features not valued by potential customers. These two features have a projected cost of 6 per unit. However, the price consumers are willing to pay for the product is the same with or without the features. Required: 1. Calculate the target cost associated with the initial 25 percent market share. Does the initial design meet this target? Now calculate the total life-cycle profit that the current (initial) design offers (including preproduction costs). 2. Assume that the two features that are apparently not valued by consumers will be eliminated. Also assume that the selling price is lowered to 125. a. Calculate the target cost for the 125 price and 35 percent market share. b. How much more cost reduction is needed? c. What are the total life-cycle profits now projected for the new product? d. Describe the three general approaches that Nico can take to reduce the projected cost to this new target. Of the three approaches, which is likely to produce the most reduction? 3. Suppose that the Engineering Department has two new designs: Design A and Design B. Both designs eliminate the two nonvalued features. Both designs also reduce production and logistics costs by an additional 8 per unit. Design A, however, leaves post-purchase costs at 10 per unit, while Design B reduces post-purchase costs to 4 per unit. Developing and testing Design A costs an additional 150,000, while Design B costs an additional 300,000. Assuming a price of 125, calculate the total life-cycle profits under each design. Which would you choose? Explain. What if the design you chose cost an additional 500,000 instead of 150,000 or 300,000? Would this have changed your decision? 4. Refer to Requirement 3. For every extra dollar spent on preproduction activities, how much benefit was generated? What does this say about the importance of knowing the linkages between preproduction activities and later activities?arrow_forwardBienestar, Inc., has two plants that manufacture a line of wheelchairs. One is located in Kansas City, and the other in Tulsa. Each plant is set up as a profit center. During the past year, both plants sold their tilt wheelchair model for 1,620. Sales volume averages 20,000 units per year in each plant. Recently, the Kansas City plant reduced the price of the tilt model to 1,440. Discussion with the Kansas City manager revealed that the price reduction was possible because the plant had reduced its manufacturing and selling costs by reducing what was called non-value-added costs. The Kansas City manufacturing and selling costs for the tilt model were 1,260 per unit. The Kansas City manager offered to loan the Tulsa plant his cost accounting manager to help it achieve similar results. The Tulsa plant manager readily agreed, knowing that his plant must keep pacenot only with the Kansas City plant but also with competitors. A local competitor had also reduced its price on a similar model, and Tulsas marketing manager had indicated that the price must be matched or sales would drop dramatically. In fact, the marketing manager suggested that if the price were dropped to 1,404 by the end of the year, the plant could expand its share of the market by 20 percent. The plant manager agreed but insisted that the current profit per unit must be maintained. He also wants to know if the plant can at least match the 1,260 per-unit cost of the Kansas City plant and if the plant can achieve the cost reduction using the approach of the Kansas City plant. The plant controller and the Kansas City cost accounting manager have assembled the following data for the most recent year. The actual cost of inputs, their value-added (ideal) quantity levels, and the actual quantity levels are provided (for production of 20,000 units). Assume there is no difference between actual prices of activity units and standard prices. Required: 1. Calculate the target cost for expanding the Tulsa plants market share by 20 percent, assuming that the per-unit profitability is maintained as requested by the plant manager. 2. Calculate the non-value-added cost per unit. Assuming that non-value-added costs can be reduced to zero, can the Tulsa plant match the Kansas City per-unit cost? Can the target cost for expanding market share be achieved? What actions would you take if you were the plant manager? 3. Describe the role that benchmarking played in the effort of the Tulsa plant to protect and improve its competitive position.arrow_forwardIn 20x5, Major Company initiated a full-scale, quality improvement program. At the end of the year, Jack Aldredge, the president, noted with some satisfaction that the defects per unit of product had dropped significantly compared to the prior year. He was also pleased that relationships with suppliers had improved and defective materials had declined. The new quality training program was also well accepted by employees. Of most interest to the president, however, was the impact of the quality improvements on profitability. To help assess the dollar impact of the quality improvements, the actual sales and the actual quality costs for 20x4 and 20x5 are as follows by quality category: All prevention costs are fixed (by discretion). Assume all other quality costs are unit-level variable. Required: 1. Compute the relative distribution of quality costs for each year and prepare a pie chart. Do you believe that the company is moving in the right direction in terms of the balance among the quality cost categories? Explain. 2. Prepare a one-year trend performance report for 20x5 (compare the actual costs of 20x5 with those of 20x4, adjusted for differences in sales volume). How much have profits increased because of the quality improvements made by Major Company? 3. Estimate the additional improvement in profits if Major Company ultimately reduces its quality costs to 2.5 percent of sales revenues (assume sales of 10 million).arrow_forward
- Gagnon Company reported the following sales and quality costs for the past four years. Assume that all quality costs are variable and that all changes in the quality cost ratios are due to a quality improvement program. Required: 1. Compute the quality costs for all four years. By how much did net income increase from Year 1 to Year 2 because of quality improvements? From Year 2 to Year 3? From Year 3 to Year 4? 2. The management of Gagnon Company believes it is possible to reduce quality costs to 2.5 percent of sales. Assuming sales will continue at the Year 4 level, calculate the additional profit potential facing Gagnon. Is the expectation of improving quality and reducing costs to 2.5 percent of sales realistic? Explain. 3. Assume that Gagnon produces one type of product, which is sold on a bid basis. In Years 1 and 2, the average bid was 400. In Year 1, total variable costs were 250 per unit. In Year 3, competition forced the bid to drop to 380. Compute the total contribution margin in Year 3 assuming the same quality costs as in Year 1. Now, compute the total contribution margin in Year 3 using the actual quality costs for Year 3. What is the increase in profitability resulting from the quality improvements made from Year 1 to Year 3?arrow_forwardMerkley Company, a manufacturer of machine parts, implemented lean manufacturing at the end of 20X1. Three value streams were established: one for new product development and two order fulfillment value streams. One of the value streams set a goal to increase its ROS to 45% of sales by the end of the year. During the year, the value stream made significant improvements in several areas. The Box Scorecard below was prepared, with performance measures for the beginning of the year, midyear, and end of year. Although the members of the value stream were pleased with their progress, they were disappointed in the financial results. They were still far from the targeted ROS of 45%. They were also puzzled as to why the improvements made did not translate into significantly improved financial performance. Required: 1. From the scorecard, what was the focus of the value-stream team for the first 6 months? The second 6 months? What are the implications of these changes? 2. Using information from the scorecard, offer an explanation for why the financial results were not as good as expected.arrow_forwardPaladin Company manufactures plain-paper fax machines in a small factory in Minnesota. Sales have increased by 50 percent in each of the past three years, as Paladin has expanded its market from the United States to Canada and Mexico. As a result, the Minnesota factory is at capacity. Beryl Adams, president of Paladin, has examined the situation and developed the following alternatives. 1. Add a permanent second shift at the plant. However, the semiskilled workers who assemble the fax machines are in short supply, and the wage rate of 15 per hour would probably have to be increased across the board to 18 per hour in order to attract sufficient workers from out of town. The total wage increase (including fringe benefits) would amount to 125,000. The heavier use of plant facilities would lead to increased plant maintenance and small tool cost. 2. Open a new plant and locate it in Mexico. Wages (including fringe benefits) would average 3.50 per hour. Investment in plant and equipment would amount to 300,000. 3. Open a new plant and locate it in a foreign trade zone, possibly in Dallas. Wages would be somewhat lower than in Minnesota, but higher than in Mexico. The advantages of postponing tariff payments on parts imported from Asia could amount to 50,000 per year. Required: Advise Beryl of the advantages and disadvantages of each of her alternatives.arrow_forward
- Wright Plastic Products is a small company that specialized in the production of plastic dinner plates until several years ago. Although profits for the company had been good, they have been declining in recent years because of increased competition. Many competitors offer a full range of plastic products, and management felt that this created a competitive disadvantage. The output of the companys plants was exclusively devoted to plastic dinner plates. Three years ago, management made a decision to add additional product lines. They determined that existing idle capacity in each plant could easily be adapted to produce other plastic products. Each plant would produce one additional product line. For example, the Atlanta plant would add a line of plastic cups. Moreover, the variable cost of producing a package of cups (one dozen) was virtually identical to that of a package of plastic plates. (Variable costs referred to here are those that change in total as the units produced change. The costs include direct materials, direct labor, and unit-based variable overhead such as power and other machine costs.) Since the fixed expenses would not change, the new product was forecast to increase profits significantly (for the Atlanta plant). Two years after the addition of the new product line, the profits of the Atlanta plant (as well as other plants) had not improvedin fact, they had dropped. Upon investigation, the president of the company discovered that profits had not increased as expected because the so-called fixed cost pool had increased dramatically. The president interviewed the manager of each support department at the Atlanta plant. Typical responses from four of those managers are given next. Materials handling: The additional batches caused by the cups increased the demand for materials handling. We had to add one forklift and hire additional materials handling labor. Inspection: Inspecting cups is more complicated than plastic plates. We only inspect a sample drawn from every batch, but you need to understand that the number of batches has increased with this new product line. We had to hire more inspection labor. Purchasing: The new line increased the number of purchase orders. We had to use more resources to handle this increased volume. Accounting: There were more transactions to process than before. We had to increase our staff. Required: 1. Explain why the results of adding the new product line were not accurately projected. 2. Could this problem have been avoided with an activity-based cost management system? If so, would you recommend that the company adopt this type of system? Explain and discuss the differences between an activity-based cost management system and a traditional cost management system.arrow_forwardSuppose that Kicker had the following sales and cost experience (in thousands of dollars) for May of the current year and for May of the prior year: In May of the prior year, Kicker started an intensive quality program designed to enable it to build original equipment manufacture (OEM) speaker systems for a major automobile company. The program was housed in research and development. In the beginning of the current year, Kickers accounting department exercised tighter control over sales commissions, ensuring that no dubious (e.g., double) payments were made. The increased sales in the current year required additional warehouse space that Kicker rented in town. (Round ratios to four decimal places. Round sales dollars computations to the nearest dollar.) Required: 1. Calculate the contribution margin ratio for May of both years. 2. Calculate the break-even point in sales dollars for both years. 3. Calculate the margin of safety in sales dollars for both years. 4. CONCEPTUAL CONNECTION Analyze the differences shown by your calculations in Requirements 1, 2, and 3.arrow_forwardJavier Company has sales of 8 million and quality costs of 1,600,000. The company is embarking on a major quality improvement program. During the next three years, Javier intends to attack failure costs by increasing its appraisal and prevention costs. The right prevention activities will be selected, and appraisal costs will be reduced according to the results achieved. For the coming year, management is considering six specific activities: quality training, process control, product inspection, supplier evaluation, prototype testing, and redesign of two major products. To encourage managers to focus on reducing non-value-added quality costs and select the right activities, a bonus pool is established relating to reduction of quality costs. The bonus pool is equal to 10 percent of the total reduction in quality costs. Current quality costs and the costs of these six activities are given in the following table. Each activity is added sequentially so that its effect on the cost categories can be assessed. For example, after quality training is added, the control costs increase to 320,000, and the failure costs drop to 1,040,000. Even though the activities are presented sequentially, they are totally independent of each other. Thus, only beneficial activities need be selected. Required: 1. Identify the control activities that should be implemented, and calculate the total quality costs associated with this selection. Assume that an activity is selected only if it increases the bonus pool. 2. Given the activities selected in Requirement 1, calculate the following: a. The reduction in total quality costs b. The percentage distribution for control and failure costs c. The amount for this years bonus pool 3. Suppose that a quality engineer complained about the gainsharing incentive system. Basically, he argued that the bonus should be based only on reductions of failure and appraisal costs. In this way, investment in prevention activities would be encouraged, and eventually, failure and appraisal costs would be eliminated. After eliminating the non-value-added costs, focus could then be placed on the level of prevention costs. If this approach were adopted, what activities would be selected? Do you agree or disagree with this approach? Explain.arrow_forward
- Jarriot, Inc., presented two years of data for its Furniture Division and its Houseware Division. Required: 1. Compute the ROI and the margin and turnover ratios for each year for the Furniture Division. (Round your answers to four significant digits.) 2. Compute the ROI and the margin and turnover ratios for each year for the Houseware Division. (Round your answers to four significant digits.) 3. Explain the change in ROI from Year 1 to Year 2 for each division.arrow_forwardIn 20x4, Tru-Delite Frozen Desserts, Inc., instituted a quality improvement program. At the end of 20x5, the management of the corporation requested a report to show the amount saved by the measures taken during the year. The actual sales and quality costs for 20x4 and 20x5 are as follows: Tru-Delites management believes that quality costs can be reduced to 2.5 percent of sales within the next five years. At the end of 20x9, Tru-Delites sales are projected to grow to 750,000. The projected relative distribution of quality costs at the end of 20x9 is as follows: Required: 1. Profits increased by what amount due to quality improvements made in 20x5? 2. Prepare a long-range performance report that compares the quality costs incurred at the end of 20x5 with the quality cost structure expected at the end of 20x9. 3. Are the targeted costs in the year 20x9 all value-added costs? How would you interpret the variances if the targeted costs are value-added costs? 4. What would be the profit increase in 20x9 if the 2.5 percent performance standard is met in that year?arrow_forwardBradford Company, a manufacturer of small tools, implemented lean manufacturing at the end of 20x1. The companys goal for the year was to increase the ROS to 40 percent of sales. A value-stream team was established and began to work on lean improvements. During the year, the team was able to achieve significant results on several fronts. The Box Scorecard below reflects the performance measures at the beginning of the year, midyear, and end of year. Although the team members were pleased with their progress, they were disappointed in the financial results. They were still far from the targeted ROS of 40 percent. They were also puzzled as to why the improvements made did not translate into significantly improved financial performance. Required: 1. From the scorecard, what was the focus of the value-stream team for the first six months? The second six months? What are the implications of these changes? 2. Using information from the scorecard, offer an explanation for why the financial results were not as good as expected. 3. Suppose that on December 31, 20x2, a potential customer offered to purchase an order of goods that would increase weekly revenues in January by 100,000 and material cost by 30,000. Using the old standard cost system, the projected conversion cost of the order would be 60,000. Would you recommend that the order be accepted or rejected? Explain.arrow_forward
 Cornerstones of Cost Management (Cornerstones Ser...AccountingISBN:9781305970663Author:Don R. Hansen, Maryanne M. MowenPublisher:Cengage Learning
 Principles of Accounting Volume 2AccountingISBN:9781947172609Author:OpenStaxPublisher:OpenStax College
 Managerial Accounting: The Cornerstone of Busines...AccountingISBN:9781337115773Author:Maryanne M. Mowen, Don R. Hansen, Dan L. HeitgerPublisher:Cengage Learning
 Excel Applications for Accounting PrinciplesAccountingISBN:9781111581565Author:Gaylord N. SmithPublisher:Cengage Learning
 Essentials of Business Analytics (MindTap Course ...StatisticsISBN:9781305627734Author:Jeffrey D. Camm, James J. Cochran, Michael J. Fry, Jeffrey W. Ohlmann, David R. AndersonPublisher:Cengage Learning
 Financial Reporting, Financial Statement Analysis...FinanceISBN:9781285190907Author:James M. Wahlen, Stephen P. Baginski, Mark BradshawPublisher:Cengage Learning