
Videos
(a)
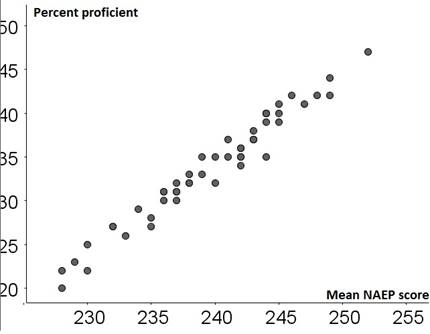
To construct the scatterplot using mean NEAP scores as the explanatory variable.
(a)
Explanation of Solution
The scatterplot for Percent proficient is as follows:
(b)
To describe the direction, form and strength of the relationship in the above
(b)
Explanation of Solution
The relationship of percent proficient scatterplot is a positiveassociation (slopes upwards), strong (points are close together) and linear (points form a line).
(c)
To circle out the home states’ points that are outliers and then choose one point and identify which state it is and in what way it is interesting.
(c)
Explanation of Solution
For the percent proficient scatterplot:
There are no outliers.
Chapter 4 Solutions
Statistics Through Applications
Additional Math Textbook Solutions
Statistics for Business and Economics (13th Edition)
Elementary Statistics: Picturing the World (6th Edition)
An Introduction to Mathematical Statistics and Its Applications (6th Edition)
Elementary Statistics
Intro Stats, Books a la Carte Edition (5th Edition)
Introductory Statistics


 MATLAB: An Introduction with ApplicationsStatisticsISBN:9781119256830Author:Amos GilatPublisher:John Wiley & Sons Inc
 Probability and Statistics for Engineering and th...StatisticsISBN:9781305251809Author:Jay L. DevorePublisher:Cengage Learning
 Statistics for The Behavioral Sciences (MindTap C...StatisticsISBN:9781305504912Author:Frederick J Gravetter, Larry B. WallnauPublisher:Cengage Learning
 Elementary Statistics: Picturing the World (7th E...StatisticsISBN:9780134683416Author:Ron Larson, Betsy FarberPublisher:PEARSON
 The Basic Practice of StatisticsStatisticsISBN:9781319042578Author:David S. Moore, William I. Notz, Michael A. FlignerPublisher:W. H. Freeman
 Introduction to the Practice of StatisticsStatisticsISBN:9781319013387Author:David S. Moore, George P. McCabe, Bruce A. CraigPublisher:W. H. Freeman