
Concept explainers
Videos
(a)
To construct the
(a)
Explanation of Solution
The scatterplot of the data is as follows:
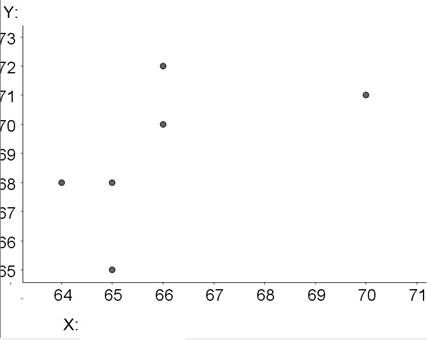
By looking at the scatterplot we can say that, since the scatterplot slopes upwards we can expect a positive relation and since the points are far apart we expect it to be to
(b)
To calculate the correlation r of the height of the men and women.
(b)
Answer to Problem 4.13E
The correlation is
Explanation of Solution
The mean of
Now to calculate standard deviation of
Consider the following table-
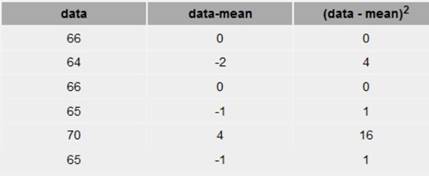
Then the sum of the numbers in the last column to get;
Calculate
The mean of
The standard deviation of
Consider the table-
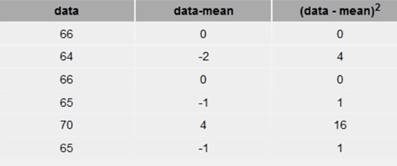
Now we calculate the sum of numbers in the last column to get;
Calculate
The correlation is determined with the formula:-
Now, we will find the value of
Now computing in the correlation formula we get,
Chapter 4 Solutions
Statistics Through Applications
Additional Math Textbook Solutions
An Introduction to Mathematical Statistics and Its Applications (6th Edition)
Elementary Statistics: Picturing the World (6th Edition)
Statistical Reasoning for Everyday Life (5th Edition)
Essentials of Statistics, Books a la Carte Edition (5th Edition)
Basic Business Statistics, Student Value Edition


 MATLAB: An Introduction with ApplicationsStatisticsISBN:9781119256830Author:Amos GilatPublisher:John Wiley & Sons Inc
 Probability and Statistics for Engineering and th...StatisticsISBN:9781305251809Author:Jay L. DevorePublisher:Cengage Learning
 Statistics for The Behavioral Sciences (MindTap C...StatisticsISBN:9781305504912Author:Frederick J Gravetter, Larry B. WallnauPublisher:Cengage Learning
 Elementary Statistics: Picturing the World (7th E...StatisticsISBN:9780134683416Author:Ron Larson, Betsy FarberPublisher:PEARSON
 The Basic Practice of StatisticsStatisticsISBN:9781319042578Author:David S. Moore, William I. Notz, Michael A. FlignerPublisher:W. H. Freeman
 Introduction to the Practice of StatisticsStatisticsISBN:9781319013387Author:David S. Moore, George P. McCabe, Bruce A. CraigPublisher:W. H. Freeman