
Concept explainers
Videos
(a)
To predict the student’s BAC if a student drinks five beers.
(a)
Answer to Problem 4.38E
Explanation of Solution
From previous exercise we have,
The predicted value is found by evaluating the least squares regression at
(b)
To explain will the regression method be as accurate for predicting BAC for a person who drinks fifteen beers.
(b)
Explanation of Solution
No it will not be accurate because the given
(c)
To construct the residual plot by using calculator and explain how well the regression line fit the data.
(c)
Explanation of Solution
Calculator commands used:
Assuming that you entered the x -values in list L1 of your calculator and the y -values in list L2 .
Use the command “
The residual plot is as follows:
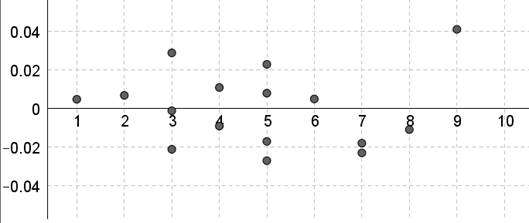
The regression line appears to fit the data well because the residuals appear to be randomly scatter about zero and there is no obvious pattern in the residuals.
(d)
To interpret the value of r2 in this setting.
(d)
Answer to Problem 4.38E
Explanation of Solution
Calculator commands used:
Assuming that you entered the x -values in list L1 of your calculator and the y -values in list L2 .
Use the commands STAT, CALC and 8:LinReg(
Next we determine the least square regression line by using LinReg(
The result should then contain r and r2 .
The result will be
Chapter 4 Solutions
Statistics Through Applications
Additional Math Textbook Solutions
STATS:DATA+MODELS-W/DVD
Basic Business Statistics, Student Value Edition (13th Edition)
Statistics: The Art and Science of Learning from Data (4th Edition)
Statistics for Psychology
Introductory Statistics
Statistical Reasoning for Everyday Life (5th Edition)


 MATLAB: An Introduction with ApplicationsStatisticsISBN:9781119256830Author:Amos GilatPublisher:John Wiley & Sons Inc
 Probability and Statistics for Engineering and th...StatisticsISBN:9781305251809Author:Jay L. DevorePublisher:Cengage Learning
 Statistics for The Behavioral Sciences (MindTap C...StatisticsISBN:9781305504912Author:Frederick J Gravetter, Larry B. WallnauPublisher:Cengage Learning
 Elementary Statistics: Picturing the World (7th E...StatisticsISBN:9780134683416Author:Ron Larson, Betsy FarberPublisher:PEARSON
 The Basic Practice of StatisticsStatisticsISBN:9781319042578Author:David S. Moore, William I. Notz, Michael A. FlignerPublisher:W. H. Freeman
 Introduction to the Practice of StatisticsStatisticsISBN:9781319013387Author:David S. Moore, George P. McCabe, Bruce A. CraigPublisher:W. H. Freeman