
Concept explainers
Videos
(a)
To construct the
(a)
Answer to Problem 4.37E
The y -variable isthe blood alcohol content.
The x -variable is the beers.
Explanation of Solution
A response variable is a variable that measures an outcome or result of a study, while an explanatory variable that we think explains or causes changes in the response variables.
The y -variable is the response variable, which we expect to be the blood alcohol content because we expect the number of beers to cause the change in the blood alcohol content.
The x -variable is the explanatory variable, which we expect to be the beers because we expect the number of beers to cause the change in the blood alcohol content.
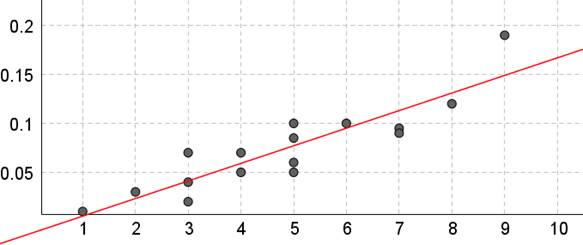
The scatterplot of the data is as follows:
The number of beers is on the horizontal axis and the residuals are on the vertical axis.
(b)
To find the
(b)
Answer to Problem 4.37E
Explanation of Solution
Calculator commands used:
Assuming that you entered the x -values in list L1 of your calculator and the y -values in list L2 .
Use the commands STAT, CALC and 8:LinReg(
Next we determine the least square regression line by using LinReg(
The result should then contain r and r2 .
The result will be
The correlation is an appropriate measure of strength because the scatterplot in part(a) does not show strong curvature.
(c)
To find the least square regression line for BAC on beers and interpret the slope and y -intercept of the regression line.
(c)
Answer to Problem 4.37E
Explanation of Solution
Calculator commands used:
Assuming that you entered the x -values in list L1 of your calculator and the y -values in list L2 .
Use the commands STAT, CALC and 8:LinReg(
Next we determine the least square regression line by using LinReg(
Result:
Thus the least square regression line is then:
a is the y -intercept which is the predicted y -value when
b is the slope which is the average increase in the y -value per unit of
Chapter 4 Solutions
Statistics Through Applications
Additional Math Textbook Solutions
Elementary Statistics Using Excel (6th Edition)
Statistics for Business and Economics (13th Edition)
Statistics: The Art and Science of Learning from Data (4th Edition)
Introductory Statistics
Elementary Statistics: Picturing the World (7th Edition)
Essentials of Statistics (6th Edition)


 MATLAB: An Introduction with ApplicationsStatisticsISBN:9781119256830Author:Amos GilatPublisher:John Wiley & Sons Inc
 Probability and Statistics for Engineering and th...StatisticsISBN:9781305251809Author:Jay L. DevorePublisher:Cengage Learning
 Statistics for The Behavioral Sciences (MindTap C...StatisticsISBN:9781305504912Author:Frederick J Gravetter, Larry B. WallnauPublisher:Cengage Learning
 Elementary Statistics: Picturing the World (7th E...StatisticsISBN:9780134683416Author:Ron Larson, Betsy FarberPublisher:PEARSON
 The Basic Practice of StatisticsStatisticsISBN:9781319042578Author:David S. Moore, William I. Notz, Michael A. FlignerPublisher:W. H. Freeman
 Introduction to the Practice of StatisticsStatisticsISBN:9781319013387Author:David S. Moore, George P. McCabe, Bruce A. CraigPublisher:W. H. Freeman