Introduction To Statistics And Data Analysis
6th Edition
ISBN: 9781337793612
Author: PECK, Roxy.
Publisher: Cengage Learning,
bartleby

Concept explainers

bartleby

Videos

Textbook Question
Book Icon
Chapter 4.4, Problem 45E

For the travel time distribution given in the previous exercise, the approximate mean and standard deviation for the travel time distribution are 27 minutes anti 24 minutes, respectively. Based on this mean and standard deviation anti the fact that travel time cannot be negative, explain why the travel time distribution could not be well approximated by a normal curve.

The U.S. Census Bureau (2000 census) reported the following relative frequency distribution for travel time to work for a large sample of adults who did not work at home:

Chapter 4.4, Problem 45E, For the travel time distribution given in the previous exercise, the approximate mean and standard

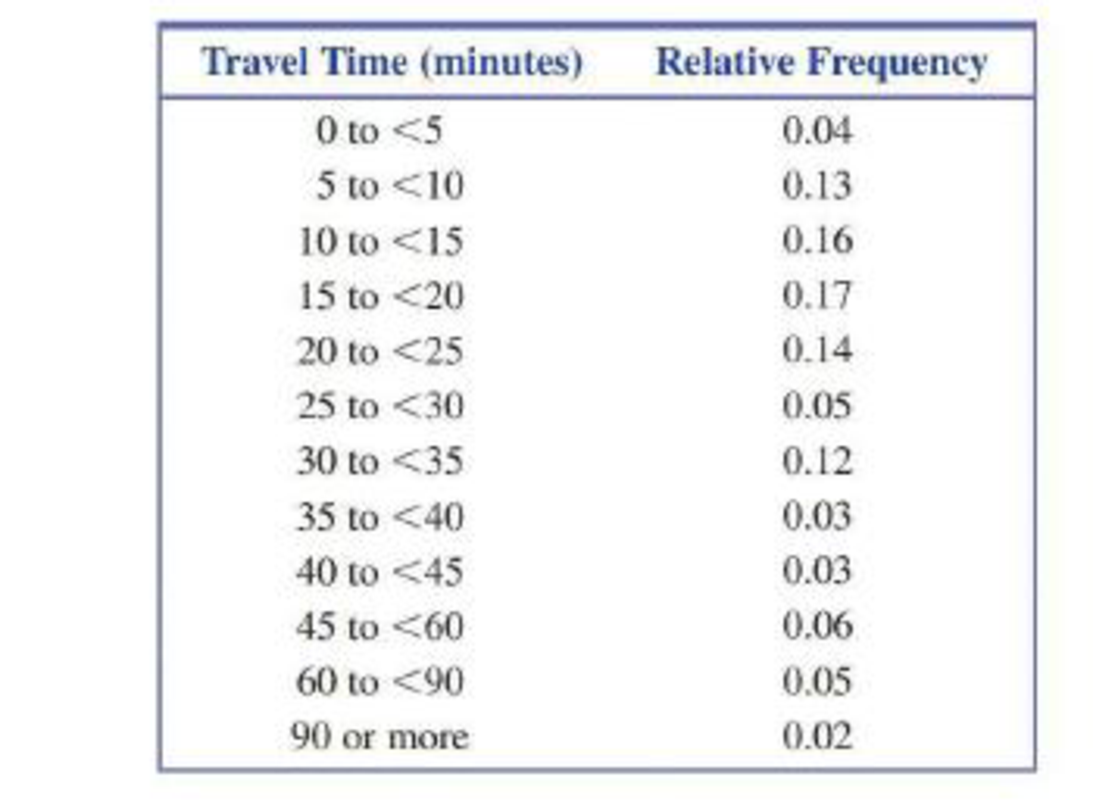
  1. a. Draw’ the histogram for the travel lime distribution. In constructing the histogram, assume that the last interval in the relative frequency distribution (90 or more) ends at 200; so the last interval is 90 to <200. Be sure to use the density scale to determine the heights of the bars in the histogram because not all the intervals have the same width. (Hint: Histograms were covered in Chapter 3.)
  2. b. Describe the interesting features of the histogram from Part (a), including center, shape, and variability.
  3. c. Based on the histogram from Part (a), would it be appropriate to use the Empirical Rule to make statements about the travel time distribution? Explain why or why not.
Blurred answer

Chapter 4 Solutions

Introduction To Statistics And Data Analysis

Ch. 4.1 - Houses in California are expensive, especially on...Ch. 4.1 - Consider the following statement: More than 65% of...Ch. 4.1 - A sample consisting of four pieces of luggage was...Ch. 4.1 - Suppose that 10 patients with meningitis received...Ch. 4.1 - A study of the lifetime (in hours) for a certain...Ch. 4.1 - An instructor has graded 19 exam papers submitted...Ch. 4.2 - The following data are costs (in cents) per ounce...Ch. 4.2 - Cost per serving (in cents) for six high-fiber...Ch. 4.2 - Combining the cost-per-serving data for high-fiber...Ch. 4.2 - Prob. 20ECh. 4.2 - The accompanying data are consistent with summary...Ch. 4.2 - The paper referenced in the previous exercise also...Ch. 4.2 - The price (in dollars) of the eight smart phones...Ch. 4.2 - In addition to the prices of the highly rated...Ch. 4.2 - In an experiment to assess the effect of listening...Ch. 4.2 - The paper referenced in the previous exercise also...Ch. 4.2 - The accompanying data on number of minutes used...Ch. 4.2 - Give two sets of five numbers that have the same...Ch. 4.2 - Morningstar is an investment research from that...Ch. 4.2 - The U.S. Department of Transportation reported the...Ch. 4.2 - The Ministry of Health and Long-Term Care in...Ch. 4.2 - In 1997, a woman sued a computer keyboard...Ch. 4.2 - The standard deviation alone does not measure...Ch. 4.3 - Based on a large national sample of working...Ch. 4.3 - The report Most Licensed Drivers Age 85+: States...Ch. 4.3 - Data on the gasoline tax per gallon (in cents) in...Ch. 4.3 - The U.S. Department of Health and Human Services...Ch. 4.3 - Fiber content (in grns per serving) for 18 high...Ch. 4.3 - In addition to the fiber contents given in the...Ch. 4.3 - Use the fiber content and sugar content data given...Ch. 4.3 - The article The Bestand WorstPlaces to be a...Ch. 4.4 - The average playing time of music albums in a...Ch. 4.4 - In a study investigating the effect of car speed...Ch. 4.4 - The U.S. Census Bureau (2000 census) reported the...Ch. 4.4 - For the travel time distribution given in the...Ch. 4.4 - Use the information given in the previous two...Ch. 4.4 - Mobile homes are tightly constructed for energy...Ch. 4.4 - The article Impact of Berkeley Excise Tax on...Ch. 4.4 - A student took two national aptitude tests. The...Ch. 4.4 - Suppose that your younger sister is applying for...Ch. 4.4 - The report Who Borrows Most? Bachelors Degree...Ch. 4.4 - The paper Study of the Flying Ability of...Ch. 4.4 - Suppose that the manufacturer of a scale claims...Ch. 4.4 - Suppose that your statistics professor returned...Ch. 4.4 - The paper Answer Changing in Multiple Choice...Ch. 4.4 - Suppose that the average reading speed of students...Ch. 4.4 - The following data values are 2014 per capita...Ch. 4.4 - The accompanying table gives the mean and standard...Ch. 4.5 - The authors of the paper Delayed Time to...Ch. 4.5 - The paper Portable Social Groups: Willingness to...Ch. 4 - Acrylamide (a possible cancer-causing substance)...Ch. 4 - Prob. 62CRCh. 4 - Because some homes have selling prices that are...Ch. 4 - Although bats are not known for their eyesight,...Ch. 4 - For the data in the previous exercise, subtract 10...Ch. 4 - For the data of Exercise 4.64, multiply each data...Ch. 4 - The Bloomberg web site included the data in the...Ch. 4 - Refer to the data given in the previous exercise....Ch. 4 - Age at diagnosis for each of 20 patients under...Ch. 4 - Suppose that the distribution of scores on an exam...
Knowledge Booster
Background pattern image
Statistics
Learn more about
Need a deep-dive on the concept behind this application? Look no further. Learn more about this topic, statistics and related others by exploring similar questions and additional content below.
Recommended textbooks for you
Text book image
MATLAB: An Introduction with Applications
Statistics
ISBN:9781119256830
Author:Amos Gilat
Publisher:John Wiley & Sons Inc
Text book image
Probability and Statistics for Engineering and th...
Statistics
ISBN:9781305251809
Author:Jay L. Devore
Publisher:Cengage Learning
Text book image
Statistics for The Behavioral Sciences (MindTap C...
Statistics
ISBN:9781305504912
Author:Frederick J Gravetter, Larry B. Wallnau
Publisher:Cengage Learning
Text book image
Elementary Statistics: Picturing the World (7th E...
Statistics
ISBN:9780134683416
Author:Ron Larson, Betsy Farber
Publisher:PEARSON
Text book image
The Basic Practice of Statistics
Statistics
ISBN:9781319042578
Author:David S. Moore, William I. Notz, Michael A. Fligner
Publisher:W. H. Freeman
Text book image
Introduction to the Practice of Statistics
Statistics
ISBN:9781319013387
Author:David S. Moore, George P. McCabe, Bruce A. Craig
Publisher:W. H. Freeman
Continuous Probability Distributions - Basic Introduction; Author: The Organic Chemistry Tutor;https://www.youtube.com/watch?v=QxqxdQ_g2uw;License: Standard YouTube License, CC-BY
Probability Density Function (p.d.f.) Finding k (Part 1) | ExamSolutions; Author: ExamSolutions;https://www.youtube.com/watch?v=RsuS2ehsTDM;License: Standard YouTube License, CC-BY
Find the value of k so that the Function is a Probability Density Function; Author: The Math Sorcerer;https://www.youtube.com/watch?v=QqoCZWrVnbA;License: Standard Youtube License