
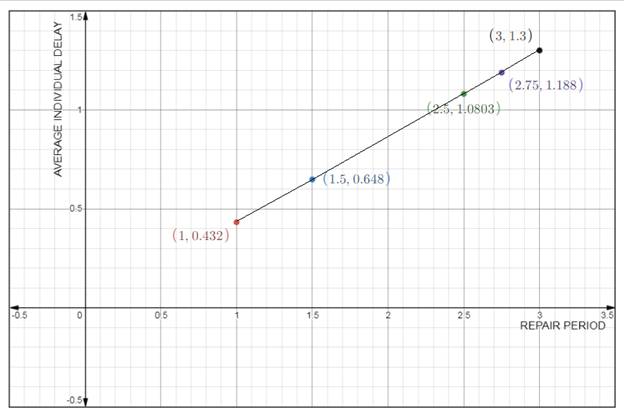
The graph of average individual delay versus the repair period and use this graph to discuss the effect of the expected repair time on the average delay.
Explanation of Solution
Given:
We have been given the following information:
We have been given the following information:
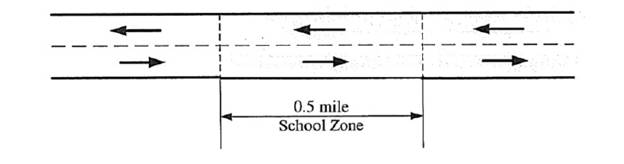
Total number of lanes = 3,
Mean free flow speed of the highway
Jam density
Following is the lay out of the given highway section:
Calculation:For the expected repair period of 1 hour.
We have the following formula for the determination of maximum queue length that will be formed:
Where,
Considering 90 percent of the flow and that the capacity of each lane is 2000 Veh/ h
Substituting the values in the following equation, we have
Themaximum queue length that will be formed is
Now, the total delay, we have the following formula
Where,
And C is the total capacity and can be found as
Now, substituting the values in the required equation, we have
The total delay is
The number of vehicles that will be affected by the incident.
To calculate the number of vehicles that will be affected by the incident can be foundusing the following formula:
Number of vehicles affected =
Substituting the values, we have
The number of vehicles that will be affected by the incident is
To calculate the average individual delay, we have the following formula:
Average individual delay
Substituting the values, we have
The average individual is
For the expected repair period of 1.5 hour.
We have the following formula for the determination of maximum queue length that will be formed:
Where,
Considering 90 percent of the flow and that the capacity of each lane is 2000 Veh/ h
Substituting the values in the following equation, we have
Themaximum queue length that will be formed is
Now, the total delay, we have the following formula
Where,
And C is the total capacity and can be found as
Now, substituting the values in the required equation, we have
The total delay is
The number of vehicles that will be affected by the incident.
To calculate the number of vehicles that will be affected by the incident can be found using the following formula:
Number of vehicles affected =
Substituting the values, we have
The number of vehicles that will be affected by the incident is
To calculate the average individual delay, we have the following formula:
Average individual delay
Substituting the values, we have
Theaverage individualdelay is
For the expected repair period of 2.5 hour.
We have the following formula for the determination of maximum queue length that will be formed:
Where,
Considering 90 percent of the flow and that the capacity of each lane is 2000 Veh/ h
Substituting the values in the following equation, we have
The maximum queue length that will be formed is
Now, the total delay, we have the following formula
Where,
And C is the total capacity and can be found as
Now, substituting the values in the required equation, we have
The total delay is
The number of vehicles that will be affected by the incident.
To calculate the number of vehicles that will be affected by the incident can be found using the following formula:
Number of vehicles affected =
Substituting the values, we have
Therefore, the number of vehicles that will be affected by the incident is
To calculate the average individual delay, we have the following formula:
Average individual delay
Substituting the values, we have
The average individualdelay is
For the expected repair period of 2.75 hour.
We have the following formula for the determination of maximum queue length that will be formed:
Where,
Considering 90 percent of the flow and that the capacity of each lane is 2000 Veh/ h
Substituting the values in the following equation, we have
Therefore, the maximum queue length that will be formed is
Now, the total delay, we have the following formula
Where,
And C is the total capacity and can be found as
Now, substituting the values in the required equation, we have
Therefore, the total delay is
The number of vehicles that will be affected by the incident.
To calculate the number of vehicles that will be affected by the incident can be found using the following formula:
Number of vehicles affected =
Substituting the values, we have
The number of vehicles that will be affected by the incident is
To calculate the average individual delay, we have the following formula:
Average individual delay
Substituting the values, we have
the average individual delay is
For the expected repair period of 3.0 hour.
We have the following formula for the determination of maximum queue length that will be formed:
Where,
Considering 90 percent of the flow and that the capacity of each lane is 2000 Veh/ h
Substituting the values in the following equation, we have
The maximum queue length that will be formed is
Now, the total delay, we have the following formula
Where,
And C is the total capacity and can be found as
Now, substituting the values in the required equation, we have
The total delay is
The number of vehicles that will be affected by the incident.
To calculate the number of vehicles that will be affected by the incident can be found using the following formula:
Number of vehicles affected =
Substituting the values, we have
The number of vehicles that will be affected by the incident is
To calculate the average individual delay, we have the following formula:
Average individual delay
Substituting the values, we have
The average individual delay is
Plot the graph of average individual delay versus the repair period is as follows:
Conclusion:
Therefore, for 1.0 hour : Themaximum queue length that will be formed is
For 1.5hour:
Themaximum queue length that will be formed is
For 2.50hour:
Themaximum queue length that will be formed is
The total delay is
The number of vehicles that will be affected by the incident is
The average individual delayis
For 2.75hour:
Themaximum queue length that will be formed is
The total delay is
The number of vehicles that will be affected by the incident is
The average individual delay is
For 3.0 hour:
Themaximum queue length that will be formed is
The total delay is
The number of vehicles that will be affected by the incident is
The average individual delay is
Want to see more full solutions like this?
Chapter 6 Solutions
Traffic and Highway Engineering

- At an impaired driver checkpoint, the time required to conduct the impairment test varies (exponentially distributed) depending on the compliance of the driver, but takes 60 seconds on average. If an average of 30 vehicles per hour arrive (according to a Poisson distribution) at the checkpoint, determine the average time spent in the system.arrow_forwardA convenience store has four available parking spaces. The owner predicts that the duration of customer shopping (the time that a customer’s vehicle will occupy a parking space) is exponentially distributed with a mean of 6 minutes. The owner knows that in the busiest hour customer arrivals are exponentially distributed with a mean arrival rate of 20 customers per hour. What is the probability that a customer will not have an open parking space available when arriving at the store?arrow_forwardAt an impaired driver checkpoint, the time required to conduct the impairment test varies (according to an exponential distribution) depending on the compliance of the driver, but takes 60 seconds on average. If an average of 30 vehicles per hour arrive (according to a Poisson distribution) at the checkpoint, determine the average time spent in the system in minutes/vehicle. Answer in whole number.arrow_forward
- Can someone please show me how to solve this step by step. Thank you Suppose you are hired by the UHM Transportation and Traffic Lab (TTL) to analyze vehicle arrivals at one lane of the interchange bridge connecting I-25 and I-40 for the period from 12:00am to 4:00am in a weekday. It is known that vehicle arrivals follow a Poisson process at this location. There is a single-loop detector embedded on this lane at the end of the interchange bridge. Since you do not want to go to the bridge to count vehicles at this time period, you decided to use the loop detector data for the analysis. Of the 720 20-second intervals (the loop detection system stores data every 20 seconds), 508 intervals were identified to have at least one vehicle detected. Assume the loop detector is free of error. Please estimate the vehicle arrival rate (vehicles per second) for this lane. With the estimated arrival rate, please calculate the probability of having three or more vehicles detected in a 20-second…arrow_forwardTo study congestion in the core of a city, a survey measured traffic volume at a busy intersection between the hours of 1300 and 1600. Describe the bias that could influence the results of this survey. Suggest ways in which the survey could be redesigned to reduce the possibility of bias.arrow_forwardThe results of a speed study are given in the form of a frequency distribution table. Find the time mean speed and space mean speed. speed rang: (2-5),(6-9),(10-13),(14-17)frequency: 1,4,0,7arrow_forward
- A municipal council on transportation is taking into account whether to base a recovery vehicle on a stretch of an highway to help clear incidents as fast a possible. The highway concerned carries over 5000 vehicles during the peak rush hour period. Traffic records show that on average, the number of incidents during the AM rush hour is 5. The council rejects any provision for a vehicle on the road if the probability of having more than 5 incidents in any one morning is less than 30%. Based on this information, should the council provide a vehicle?arrow_forwardConsidering the cumulative arrivals and departures of a freeway bottleneck location below, what is the capacity of the bottleneck location Considering the cumulative arrivals and departures of a freeway bottleneck location below, what is the maximum size of queue that forms? Considering the cumulative arrivals and departures of a freeway bottleneck location below, what is the longest wait time that any vehicle experiences?arrow_forwardAssume vehicle arrivals are random. On average, six vehicles arrive in one minute. Calculate theprobability of observing less than three vehicles over three minutes. Calculate the probability ofobserving a headway of less than eight seconds.arrow_forward
- A multiple regression analysis shows the following relationship for the number of trips per household. T = 0.82 + 1.3P + 2.1A Where T = number of trips per household per day P= number of persons per household A= number of autos per household If a particular TAZ contains 250 households with an average of 4 persons and 2 autos for each household, determine the average number of trips per day in that zonearrow_forwardNeed type answer a. A section of road has 55 accidents recorded in three years. For the same period, the estimated vehicle travel on the section was 23 mvk. Considering only those sections having the same characteristics as the section under study, the mean rate is 80 accidents per 100 mvk. Is the section hazardous with 90 percent level of confidence? b. Based on the graph of the accidents time per day on ‘explain’, what time makes up the most number of accidents? Discuss and explain why the frequency of accident is high.arrow_forwardFind the crash frequency and crash rate of the following: Road Segment A: A three-mile section of road that has had four crashes over five years and has a traffic volume of 5,500 vehicles per day. Road Segment B: A three-mile section of road that has had 10 crashes over five years and has a traffic volume of 18,000 vehicles per day.arrow_forward
 Traffic and Highway EngineeringCivil EngineeringISBN:9781305156241Author:Garber, Nicholas J.Publisher:Cengage Learning