
Concept explainers
(a)
The maximum queue length that will be formed, total delay, number of vehicles that will be affected by the incident, the average individual delay for the expected demand flow of 70%of the capacity of the highway.
Answer to Problem 20P
For 70 % expected demand flow:
Themaximum queue length that will be formed is
The total delay is
The number of vehicles that will be affected by the incident is
The average individual delay is
Explanation of Solution
Given:
We have been given the following information:
Total number of lanes = 3,
Mean free flow speed of the highway
Jam density
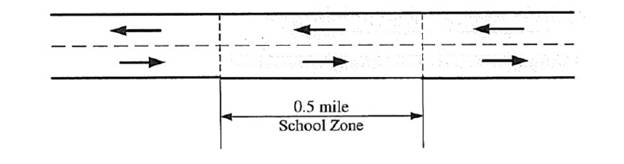
Following is the lay out of the given highway section:

Calculation:
For the expected 70 % demand flow:
We have the following formula for the determination of maximum queue length that will be formed:
Where,
Considering 70 percent of the flow and that the capacity of each lane is 2000 Veh/ h
Substituting the values in the following equation, we have
The maximum queue length that will be formed is
Now, the total delay, we have the following formula
Where,
And C is the total capacity and can be found as
Now, substituting the values in the required equation, we have
The total delay is
The number of vehicles that will be affected by the incident.
To calculate the number of vehicles that will be affected by the incident can be found using the following formula:
Number of vehicles affected =
Substituting the values, we have
The number of vehicles that will be affected by the incident is
To calculate the average individual delay, we have the following formula:
Average individual delay
Substituting the values, we have
The average individual delay is
Conclusion:
Therefore, for 70 % expected demand flow:
Themaximum queue length that will be formed is
The number of vehicles that will be affected by the incident is
(b)
The maximum queue length that will be formed, total delay, number of vehicles that will be affected by the incident, the average individual delay for the expected demand flow of 75%of the capacity of the highway.
Answer to Problem 20P
For 75 % expected demand flow:
Themaximum queue length that will be formed is
The total delay is
The number of vehicles that will be affected by the incident is
The average individual delay is
Explanation of Solution
Given:
We have been given the following information:
Total number of lanes = 3,
Mean free flow speed of the highway
Jam density
Following is the lay out of the given highway section:

Calculation:
For the expected 75 % demand flow:
We have the following formula for the determination of maximum queue length that will be formed:
Where,
Considering 75 percent of the flow and that the capacity of each lane is 2000 Veh/ h
Substituting the values in the following equation, we have
Themaximum queue length that will be formed is
Now, the total delay, we have the following formula
Where,
And C is the total capacity and can be found as
Now, substituting the values in the required equation, we have
The total delay is
The number of vehicles that will be affected by the incident.
To calculate the number of vehicles that will be affected by the incident can be found using the following formula:
Number of vehicles affected =
Substituting the values, we have
The number of vehicles that will be affected by the incident is
To calculate the average individual delay, we have the following formula:
Average individual delay
Substituting the values, we have
The average individual delay is
Conclusion:
For 75 % expected demand flow:
Themaximum queue length that will be formed is
(c)
The maximum queue length that will be formed, total delay, number of vehicles that will be affected by the incident, the average individual delay for the expected demand flow of 80% of the capacity of the highway.
Answer to Problem 20P
For 80 % expected demand flow:
Themaximum queue length that will be formed is
The total delay is
The number of vehicles that will be affected by the incident is
The average individual delay is
Explanation of Solution
Given:
We have been given the following information:
Total number of lanes = 3,
Mean free flow speed of the highway
Jam density
Following is the lay out of the given highway section:

Calculation:
For the expected 80 % demand flow:
We have the following formula for the determination of maximum queue length that will be formed:
Where,
Considering 80 percent of the flow and that the capacity of each lane is 2000 Veh/ h
Substituting the values in the following equation, we have
The maximum queue length that will be formed is
Now, the total delay, we have the following formula
Where,
And C is the total capacity and can be found as
Now, substituting the values in the required equation, we have
The total delay is
The number of vehicles that will be affected by the incident.
To calculate the number of vehicles that will be affected by the incident can be found using the following formula:
Number of vehicles affected =
Substituting the values, we have
Therefore, the number of vehicles that will be affected by the incident is
To calculate the average individual delay, we have the following formula:
Average individual delay
Substituting the values, we have
The average individual delay is
Conclusion:
For 80 % expected demand flow:
Themaximum queue length that will be formed is
the average individual delay is
(d)
The maximum queue length that will be formed, total delay, number of vehicles that will be affected by the incident, the average individual delay for the expected demand flowof 85% of the capacity of the highway.
Answer to Problem 20P
For 85 % expected demand flow:
Themaximum queue length that will be formed is
The total delay is
The number of vehicles that will be affected by the incident is
The average individual delay is
Explanation of Solution
Given:
We have been given the following information:
Total number of lanes = 3,
Mean free flow speed of the highway
Jam density
Following is the lay out of the given highway section:
Calculation:
For the expected 85 % demand flow:
We have the following formula for the determination of maximum queue length that will be formed:
Where,
Considering 85 percent of the flow and that the capacity of each lane is 2000 Veh/ h
Substituting the values in the following equation, we have
Therefore, the maximum queue length that will be formed is
Now, the total delay, we have the following formula
Where,
And C is the total capacity and can be found as
Now, substituting the values in the required equation, we have
Therefore, the total delay is
The number of vehicles that will be affected by the incident.
To calculate the number of vehicles that will be affected by the incident can be found using the following formula:
Number of vehicles affected =
Substituting the values, we have
The number of vehicles that will be affected by the incident is
To calculate the average individual delay, we have the following formula:
Average individual delay
Substituting the values, we have
the average individual delay is
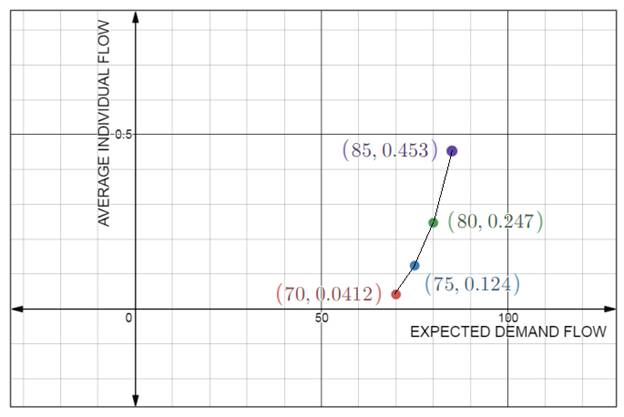
The graph of average individual delay versus the expected demand flow is as follows:
Conclusion:
For 85 % expected demand flow:
Themaximum queue length that will be formed is
the average individual delay is
Want to see more full solutions like this?
Chapter 6 Solutions
Traffic and Highway Engineering


- Vehicles arrive at a stop sign at the corner of Osmeña and Laurel Streets at the rate of 200 vehicles per hour. The waiting time for each vehicle at the stop sign is 12 seconds. If both arrival and departures are exponentially distributed, what is the average delay per vehicle in seconds?arrow_forwardThe number of vehicles arriving at the upstream of a freeway bottleneck (free of queues) is shown in the table below. Based on the numbers given in the table, determine: (1) Bottleneck capacity in vehicles per hour (vph) (2) Downstream measured flow rate in the third time interval (3) The demand during the third time interval (4) Queue length at the end of the third and fourth intervalsarrow_forwardA freeway with two northbound lanes is shut down because of an accident. At the time of theaccident, the traffic flow rate is 1200 vehicles per hour per lane and the flow remains at this level.The capacity of the freeway is 2200 vehicles per hour per lane when not impacted by an accident.The freeway is shut down completely for 20 minutes after the accident and then one lane is openfor 20 minutes and finally both lanes are opened (40 minutes after the accident). What is theaverage delay per vehicle resulting from the accident (assuming D/D/1 queuing)?arrow_forward
- Two lanes of the four lanes on a highway section have to be closed to undertake an emergency bridge repair that is expected to take 120minutes hr. The highway's mean free speed is 90km/h, and the jam density is 140 veh/km/ln. If it is estimated that the demand flow on the highway during the emergency repairs is 80% of the capacity (max flow), using the deterministic approach, determine: 1. The maximum queue length that will be formed.2. The number of vehicles that will be affected by the incident.3. The average individual delay.arrow_forwardvehicles arrive at roadway section at a rate of 300 veh/h according to a Poisson distribution. During a 40 minute interval, how many of the headways will be greater than 4 seconds on average?arrow_forwardThe following table shows 5 – min vehicle counts that have been recorded for a given transportation facility during A.M. peak hour: a.) Determine the maximum flow rate (veh/hr) that accounts for the peak 5-min interval within the hour. b.) Determine the maximum flow rate (veh/hr) that accounts for the peak 15-min interval. c.) Determine the peak hour factor, based on peak 15 – min counts.arrow_forward
- The average queue length at the intersection of the two roads with a stop signs is 4 vehicles. If the arrival rate of vehicles at the stop sign is 300 vehicles per hour, determine the service rate of the road in vehicles per hour. Assume both arrival and departure rates are exponentially distributed.arrow_forwardAt the exit of a toll gate with a single booth, vehicles arrive at random at a rate of 20 vehicles per minute. The service has an average rate of 22 vehicles per minute. However, due to variable toll fees, the service is also random with an average rate of 22 vehicles per minute. If the operator of the toll road in the previous problem wants to improve the current condition at the toll plaza, determine the new queue characteristics if the number of toll booths is increased to 2. Estimate the average waiting time of vehiclesarrow_forwardAt the exit of a toll gate with a single booth, vehicles arrive at random at a rate of 20 vehicles per minute. The service has an average rate of 22 vehicles per minute. However, due to variable toll fees, the service is also random with an average rate of 22 vehicles per minute. If the operator of the toll road in the previous problem wants to improve the current condition at the toll plaza, determine the new queue characteristics if the number of toll booths is increased to 2. Estimate average time vehicles spent in the system Group of answer choices 0.05 0.04 0.06 0.07arrow_forward
- An incident occurs on a freeway that has a capacity in the north bound direction, before incident, of 4000 veh/h and a constant flow of 2900 veh/h during the morning commute (no adjustments to traffic flow result from the incident). At 8:00am, a vehicle crash closes the freeway to all traffic. At 8:12am, the freeway is partially opened with a capacity of 2000 veh/h. Finally, the crash site is removed and the freeway is restored to full capacity of 4000 veh/h at 8:31am. Assuming the traffic follows a D/D/1 queueing (FIFO queue discipline) to determine time of queue dissipation, longest queue length, total delay, average delay per vehicle, and longest wait of any vehicle.arrow_forwardWhen an incident occurs that causes two lanes to be closed, a three-lane highway in one direction is carrying a total volume of 4700 veh/h. Calculate the maximum queue length, total delay, number of vehicle impacted by the event and average individual delays if the highways capacity is 2550 veh/h/ln. It takes 120 minutes to clear the obstacle.arrow_forwardPassenger car arrive at the stop sign at an average rate of 280 per hour. Average waiting time at the stop sign is 12 sec. If both arrivals and departure are exponentially distributed, what would be the average delay per vehicle in minutes. Assume both arrival and departure rates are exponentially distributed.arrow_forward
 Traffic and Highway EngineeringCivil EngineeringISBN:9781305156241Author:Garber, Nicholas J.Publisher:Cengage Learning