Concept explainers
Videos
An Hfr strain is used to map three genes in an interrupted mating experiment. The cross is Hfr/a+b+c+rif × F−>a−b−c−rifr. (No map order is implied in the listing of the alleles; rifr is resistance to the antibiotic rifampicin.) The a+ gene is required for the biosynthesis of nutrient A, the b+ gene for nutrient B, and c+ for nutrient C. The minus alleles are auxotrophs for these nutrients. The cross is initiated at time = 0, and at various times, the mating mixture is plated on three types of medium. Each plate contains minimal medium (MM) plus rifampicin plus specific supplements that are indicated in the following table. (The results for each time interval are shown as the number of colonies growing on each plate.)
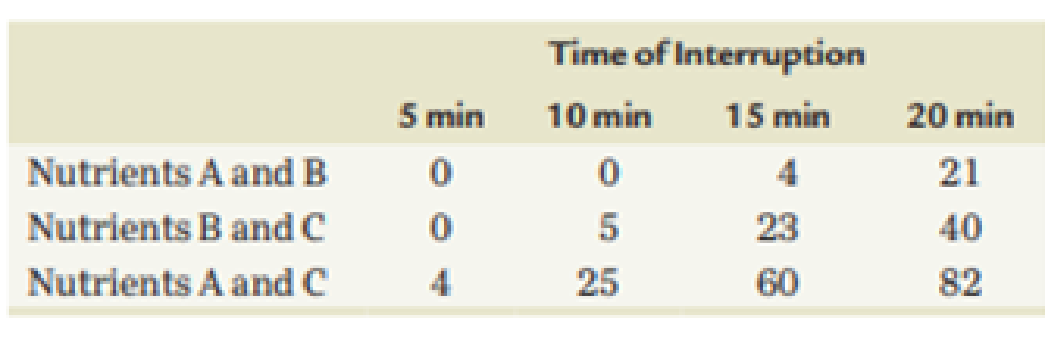
- (a) What is the purpose of rifampicin in the experiment?
- (b) Based on these data, determine the approximate location on the chromosome of the a, b, and c genes relative to one another and to the F factor.
- (c) Can the location of the rif gene be determined in this experiment? If not, design an experiment to determine the location of rif relative to the F factor and to gene b.
Want to see the full answer?
Check out a sample textbook solution
Chapter 6 Solutions
EBK CONCEPTS OF GENETICS


- For each of the E. coli strains containing the lacoperon alleles listed, indicate whether the strain isinducible, constitutive, or unable to expressβ-galactosidase and permease.a. I+ o+ Z− Y+/ I+ ocZ+ Y+b. I+ o+ Z+ Y+/ I− ocZ+ Y−c. I+ o+ Z− Y+/ I− ocZ+ Y−d. I−P− o+ Z+ Y−/ I+ P+ ocZ− Y+e. Iso+ Z+ Y+/ I− o+ Z+ Y−arrow_forwardFour Hfr strains are derived from an F+ strain of E. Coli to serve as donors for an interrupted-mating experiment. Use the time-table and partial map of the F+ strain (shown below) to determine the genes’ respective positions. Keep in mind that the map distances are NOT proportional, only the FIRST 5 markers are indicated per strain, and the entry times, recorded in minutes, are in parentheses. Transferred genes represent wild-type alleles. Based on the data, which gene can be located at position 5 on the map?arrow_forwardA cross is made between two E. coli strains: Hfr arg + bio + leu+ × F− arg − bio − leu−. Interrupted mating studies show that arg+ enters the recipient last, and so arg+ recombinants are selected on a medium containing bio and leu only. These recombinants are tested for the presence of bio + and leu+. The following numbers of individuals are found for each genotype: arg+ bio+ leu+ 320 arg+ bio- leu+ 0 arg+ bio+ leu- 8 arg+ bio- leu- 48a. What is the gene order? b. What are the map distances in recombination percentages?arrow_forward
- The following recombinants are recovered when conjugation occurs between an a+d+g+ donor and an a d'g recipient. at dt g+= 84% ad g+= 6% at dg+ = 10% ad g+= less than 1% What is the map distance between the a and d genes? 6 map units less than 1 map unit 10 map units 84 map units 74 map unitsarrow_forwardWith the technique of interrupted mating four Hfr strains were tested for the sequence in which they transmitted a number of different genes to an F strain. Each Hfr strain was found to transmit its genes is a unique sequence, as shown in the accompanying table. What is the gene sequence in the original strain from which these Hfr strains were derived?arrow_forwardA bacterial strain with genotype his− leu− thr− is transformed with DNA from a strain that is his+ leu+ thr+. A few leu+ thr+ cells and a few his+ thr+ cells are found, but no his+ leu+ cells are observed. Which genes are farthest apart?arrow_forward
- An Hfr strain that is lacZ" and galE" was mated to a strain that is lacZ and galE. The mating was interrupted and the percentage of recombinants for each gene was determined by streaking on plates that contain either lactose or galactose as the sole carbon source. The following results were obtained: 30- lacz 20 10- galE 01 10 16 20 25 30 40 50 Duration of mating (minutes) (i) Determine the map distance (in minutes) between these two genes. In a previous experiment, it was found that lacZ is 6 minutes away from gene hisB. galE was shown to be 15 minutes from this gene. Draw a genetic map describing the locations of all three genes. (ii) % of F recipient cells that have received the gene during conjugationarrow_forwardThree different Hfr strains, derived from the same F* strains (H), were mated with F strains auxotrophic for a number of nutritional requirements (trp bio leu azi mal tyr gal ). Matings were interrupted at various intervals and cells were plated on minimal medium supplemented with particular nutrients to test for gene transfer. The following mapping data was obtained: Genes mal Hfr strains leu 25 trp 17 bio azi gal* tyr Hfr H Hfr 1 Hfr 2 Hfr 3 Hfr 4 4 10 10 18 3 9. 16 14 22 15 3 19 19 11 4 8 Draw a circular map of E. coli chromosome. Include distances (in minutes) between genes in your map and label arrowheads to show the origin of transfer for the five Hfr strains.arrow_forwardAn Hfrstrain that is a *b*c*d* e*f* g *h* is mated with an F strain that is a b e d e f gh. The mating is interrupted at 5 minutes interval, and the genotypes of the F recombinants are determined. The results obtained are tabulated in Table 2. Draw the map of the Hfrchromosome and indicate the position of the origin of transfer, the direction of the transfer and the minutes between genes. Table 2:Entry time of Hfr chromosome into recipient cell. Time a d e f h 5 10 15 20 25 30 35 40 45 50 55 60 65 70 75 80 85 + + + + + + + + + + + + + + + + + + + + + + + + + + + + + + + + +arrow_forward
- DNA from a strain of Bacillus subtilis with genotype a+ b+ c+ d+ e+ is used to transform a strain with genotype a− b− c− d− e−. Pairs of genes are checked for cotransformation, and the following results are obtained: Pair of genes Cotransformation Pair of genes Cotransformation a+ and b+ No b+ and d+ No a+ and c+ No b+ and e+ Yes a+ and d+ Yes c+ and d+ No a+ and e+ Yes c+ and e+ Yes b+ and c+ Yes d+ and e+ No On the basis of these results, what is the order of the genes on the bacterial chromosome?arrow_forwardThe synthesis of flower pigments is known to be dependent on enzymatically controlled biosynthetic pathways. For the crosses shown here, postulate the role of mutant genes and their products in producing the observed phenotypes: (a) P1: white strain A * white strain B F1: all purple F2: 9/16 purple: 7/16 white (b) P1: white * pink F1: all purple F2: 9/16 purple: 3/16 pink: 4/16 whitearrow_forwardThree different Hfr strains, derived from the same F strains (H), were mated with F- strains auxotrophic for a number of nutritional requirements (trp bio leu azi mal tyr gal ). Matings were interrupted at various intervals and cells were plated on minimal medium supplemented with particular nutrients to test for gene transfer. The following mapping data was obtained: Genes Hfr strains bio leu azi mal gal trp 17 tyr Hfr H Hfr 1 Hfr 2 Hfr 3 Hfr 4 25 4 10 10 18 3 5 9. 1 16 14 22 15 3 19 19 11 4 8 Draw a circular map of E. coli chromosome. Include distances (in minutes) between genes in your map and label arrowheads to show the origin of transfer for the five Hfr strains. (10arrow_forward
 Biology: The Dynamic Science (MindTap Course List)BiologyISBN:9781305389892Author:Peter J. Russell, Paul E. Hertz, Beverly McMillanPublisher:Cengage Learning