
PRIN.OF CORPORATE FINANCE
13th Edition
ISBN: 9781260013900
Author: BREALEY
Publisher: RENT MCG
expand_more
expand_more
format_list_bulleted
Concept explainers
Videos
Textbook Question
Chapter 7, Problem 12PS
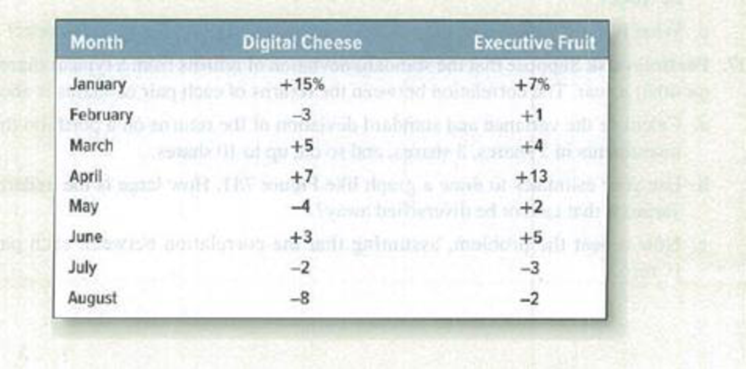
Diversification* Here are the percentage returns on two stocks,
- a) Calculate the monthly variance and standard deviation of each stock. Which stock is the riskier if held oil its own?
- b) Now calculate the variance and standard deviation of the returns on a portfolio that invests an equal amount each month in the two stocks.
- c) Is the variance more or less than half way between the variance of the two individual stocks?
Expert Solution & Answer
Want to see the full answer?
Check out a sample textbook solution
Students have asked these similar questions
Here are the returns on two stocks.
A. Calculate the variance and standard deviation of each stock. Which stock is riskier if held on its own?
B. Now calculate the returns in each month of a portfolio that invests an equal amount each month in the two stocks
C. Is the variance more or less than halfway between the variance of the two Individual stocks?
The following shows the expected percentage returns on three stocks over the next six years:
Stock
Percentage Return (%)
Year
1
2
3
4
5
6
A
10
5
6
8
12
15
B
8
4
4.8
6.4
9.6
12
C
5
10
12
10
6
6
Required:
i Find the expected return for each of the stock.
ii Compute the variance and standard deviation for stock A, B and C. Show your working.
iii Justify how can you minimize the risk of the above combination of stocks.
The following shows the expected percentage returns on three stocks over the next six years:Stock Percentage Return (%)Year 1 2 3 4 5 6A 10 5 6 8 12 15B 8 4 4. 80 6.4 9.6 12C 5 10 12 10 6 6
Required:(i) Find the expected return for each of the stock.(ii) Compute the variance and standard deviation for stock A, B and C. Show your working.(iii) Justify how can you minimize the risk of the above combination of stocks. (Must show working method as well)
Chapter 7 Solutions
PRIN.OF CORPORATE FINANCE
Ch. 7 - Rate of return The level of the Syldavia market...Ch. 7 - Real versus nominal returns The Costaguana stock...Ch. 7 - Arithmetic average and compound returns Integrated...Ch. 7 - Risk premiums Here are inflation rates and U.S....Ch. 7 - Risk Premium Suppose that in year 2030, investors...Ch. 7 - Stocks vs. bonds Each of the following statements...Ch. 7 - Expected return and standard deviation A game of...Ch. 7 - Standard deviation of returns The following table...Ch. 7 - Average returns and standard deviation During the...Ch. 7 - Prob. 10PS
Ch. 7 - Prob. 11PSCh. 7 - Diversification Here are the percentage returns on...Ch. 7 - Risk and diversification In which of the following...Ch. 7 - Prob. 14PSCh. 7 - Portfolio risk To calculate the variance of a...Ch. 7 - Portfolio risk a) How many variance terms and how...Ch. 7 - Portfolio risk Table 7.8 shows standard deviations...Ch. 7 - Portfolio risk Hyacinth Macaw invests 60% of her...Ch. 7 - Stock betas What is the beta of each of the stocks...Ch. 7 - Stock betas There are few, if any, real companies...Ch. 7 - Portfolio betas A portfolio contains equal...Ch. 7 - Portfolio betas Suppose the standard deviation of...Ch. 7 - Portfolio risk Here are some historical data on...Ch. 7 - Portfolio risk Suppose that Treasury bills offer a...
Knowledge Booster


Learn more about
Need a deep-dive on the concept behind this application? Look no further. Learn more about this topic, finance and related others by exploring similar questions and additional content below.Similar questions
- The following table reports the percentage of stocks in a portfolio for nine quarters: a. Construct a time series plot. What type of pattern exists in the data? b. Use trial and error to find a value of the exponential smoothing coefficient that results in a relatively small MSE. c. Using the exponential smoothing model you developed in part (b), what is the forecast of the percentage of stocks in a typical portfolio for the second quarter of year 3?arrow_forwardTwo-Asset Portfolio Stock A has an expected return of 12% and a standard deviation of 40%. Stock B has an expected return of 18% and a standard deviation of 60%. The correlation coefficient between Stocks A and B is 0.2. What are the expected return and standard deviation of a portfolio invested 30% in Stock A and 70% in Stock B?arrow_forwardInvestment advisors estimated the stock market returns for four market segments: computers, financial, manufacturing, and pharmaceuticals. Annual return projections vary depending on whether the general economic conditions are improving, stable, or declining. The anticipated annual return percentages for each market segment under each economic condition are as follows: Assume that an individual investor wants to select one market segment for a new investment. A forecast shows improving to declining economic conditions with the following probabilities: improving (0.2), stable (0.5), and declining (0.3). What is the preferred market segment for the investor, and what is the expected return percentage? At a later date, a revised forecast shows a potential for an improvement in economic conditions. New probabilities are as follows: improving (0.4), stable (0.4), and declining (0.2). What is the preferred market segment for the investor based on these new probabilities? What is the expected return percentage?arrow_forward
- Covariance and Correlation The following table shows the expected returns from six different stocks in three different states of the economy: State of Economy Probability Return Stock A Return Stock B Return Stock C Return Stock D Return Stock E Return Stock F Growth 0.25 31% 3% 15% 21% 0% 18% Status Quo 0.50 21% 1% 3% 7% 4% 3% Recession 0.25 20% 4% -5% -6% 6% -4% Calculate the expected return for each stock. Calculate the standard deviation for each stock. Consider of a portfolio consisting of 50% in Stock A and 50% in Stock B. Calculate the covariance between Stocks A and B. Calculate the expected return of the portfolio. Calculate the standard deviation of the portfolio. Consider of a portfolio consisting of 50% in Stock C and 50% in Stock D. Calculate the covariance between Stocks C and D. Calculate the expected return of the portfolio. Calculate the standard deviation of the portfolio.…arrow_forwardSuppose that the standard deviation of returns from a typical share is about 0.43 (or 43%) a year. The correlation between the returns of each pair of shares is about 0.3. a. Calculate the variance and standard deviation of the returns on a portfolio that has equal investments in 2 shares, 3 shares, and so on, up to 10 shares. (Use decimal values, not percents, in your calculations. Do not round intermediate calculations. Round the "Variance" answers to 6 decimal places. Round the "Standard Deviation" answers to 3 decimal places.) b. How large is the underlying market variance that cannot be diversified away? (Do not round intermediate calculations. Round your answer to 3 decimal places.) c. Now assume that the correlation between each pair of stocks is zero. Calculate the variance and standard deviation of the returns on a portfolio that has equal investments in 2 shares, 3 shares, and so on, up to 10 shares. (Use decimal values, not percents, in your calculations. Do not…arrow_forwardThe table below presents the returns on stocks ABC and XYZ for a five-year period. Year ABC XYZ 1 0.16 0.12 2 0.42 0.62 3 -0.02 -0.23 4 -0.26 -0.62 5 0.48 0.52 Calculate the average return, and standard deviation of stock ABC and XYZ. Also calculate the correlation between the two stocks. What does the correlation tell you about the return movements of the two stocks? Calculate the weight of each stock in the minimum variance portfolio, assume the expected return equals to average return for each stock. Find the mix of stocks ABC and XYZ that gives a portfolio on the efficient frontier AND demonstrate why this portfolio is on the efficient frontier by showing that there exists another portfolio of stocks ABC and XYZ that has the same level of risk (portfolio standard deviation) but inferior return. Hint: manipulate the weights you get from part b. Suppose the risk-free rate is 6%. Also assume the…arrow_forward
- Suppose Johnson & Johnson and the Walgreen Company have expected returns and volatilities shown below, with a correlation of 22%. Calculate the expected return of a portfolio that is equally invested in J&J and Walgreen’s stock. Calculate the volatility (standard deviation) of a portfolio that is equally invested in Johnson & Johnson’s and Walgreen’s stock.arrow_forwardHere are the returns on two stocks. Digital Cheese Executive Fruit January +18 +6 February −3 +2 March +5 +4 April +7 +16 May −4 +3 June +3 +6 July −2 −3 August −8 −2 Required: a-1. Calculate the variance and standard deviation of each stock. a-2. Which stock is riskier if held on its own? b. Now calculate the returns in each month of a portfolio that invests an equal amount each month in the two stocks. c. Is the variance more or less than halfway between the variance of the two individual stocks?arrow_forwardQuestion; In considering the purchase of a certain stock, you attach the following probabilities to possible changes in the stock price over the next year. What is the expected value, the variance, and the standard deviation? Which is the most likely outcome? please use the tablearrow_forward
arrow_back_ios
arrow_forward_ios
Recommended textbooks for you
 Intermediate Financial Management (MindTap Course...FinanceISBN:9781337395083Author:Eugene F. Brigham, Phillip R. DavesPublisher:Cengage Learning
 EBK CONTEMPORARY FINANCIAL MANAGEMENTFinanceISBN:9781337514835Author:MOYERPublisher:CENGAGE LEARNING - CONSIGNMENT
 Essentials of Business Analytics (MindTap Course ...StatisticsISBN:9781305627734Author:Jeffrey D. Camm, James J. Cochran, Michael J. Fry, Jeffrey W. Ohlmann, David R. AndersonPublisher:Cengage Learning
Intermediate Financial Management (MindTap Course...
Finance
ISBN:9781337395083
Author:Eugene F. Brigham, Phillip R. Daves
Publisher:Cengage Learning
EBK CONTEMPORARY FINANCIAL MANAGEMENT
Finance
ISBN:9781337514835
Author:MOYER
Publisher:CENGAGE LEARNING - CONSIGNMENT
Essentials of Business Analytics (MindTap Course ...
Statistics
ISBN:9781305627734
Author:Jeffrey D. Camm, James J. Cochran, Michael J. Fry, Jeffrey W. Ohlmann, David R. Anderson
Publisher:Cengage Learning
Dividend disocunt model (DDM); Author: Edspira;https://www.youtube.com/watch?v=TlH3_iOHX3s;License: Standard YouTube License, CC-BY