
PRIN.OF CORPORATE FINANCE
13th Edition
ISBN: 9781260013900
Author: BREALEY
Publisher: RENT MCG
expand_more
expand_more
format_list_bulleted
Concept explainers
Videos
Textbook Question
Chapter 7, Problem 7PS
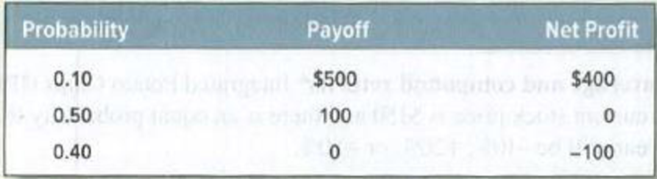
Expected return and standard deviation A game of chance offers the following odds and payoffs. Each play of the game costs $100, so the net profit per play is the payoff less $100.
What are the expected cash payoff and expected
Expert Solution & Answer
Want to see the full answer?
Check out a sample textbook solution
Students have asked these similar questions
A game of chance offers the following odds and payoffs. Each play of the game costs $200, so the net profit per play is the payoff less $200.
Probability
Payoff
Net Profit
0.10
$700
$500
0.50
300
100
0.40
0
–200
a-1. What is the expected cash payoff? (Round your answer to the nearest whole dollar amount.)
a-2. What is the expected rate of return? (Enter your answer as a percent rounded to the nearest whole number.)
b-1. What is the variance of the expected returns? (In the calculation, use the percentage values, not the decimal values for the rates of return. Do not round intermediate calculations. Round your answer to the nearest whole number.)
b-2. What is the standard deviation of the expected returns? (Enter your answer as a percent rounded to 2 decimal places.)
Consider an investment with the following probability distribution:
Probability
Payoff
0.40
30.0
%
0.35
-4.0
0.25
-14.0
Calculate the expected return. Do not round intermediate calculations. Round your answer to two decimal places.
%
Calculate the standard deviation. Do not round intermediate calculations. Round your answer to two decimal places.
%
Calculate the coefficient of variation. Do not round intermediate calculations. Round your answer to two decimal places.
The cash position of a merchant is 10000 bushels of wheat , the variance of the changes of forward price is 0.00094, the variance of the changes of the base is 0.000453, the variance of the cash price changes is 0.000805 and the covariance of the changes of forward price with the changes of the cash prices is 0.000518. Calculate the efficiency of the hedge and choose one of the following answers.
a. 0.97
b. 0.31
c. 0.69
d. 0.03
Chapter 7 Solutions
PRIN.OF CORPORATE FINANCE
Ch. 7 - Rate of return The level of the Syldavia market...Ch. 7 - Real versus nominal returns The Costaguana stock...Ch. 7 - Arithmetic average and compound returns Integrated...Ch. 7 - Risk premiums Here are inflation rates and U.S....Ch. 7 - Risk Premium Suppose that in year 2030, investors...Ch. 7 - Stocks vs. bonds Each of the following statements...Ch. 7 - Expected return and standard deviation A game of...Ch. 7 - Standard deviation of returns The following table...Ch. 7 - Average returns and standard deviation During the...Ch. 7 - Prob. 10PS
Ch. 7 - Prob. 11PSCh. 7 - Diversification Here are the percentage returns on...Ch. 7 - Risk and diversification In which of the following...Ch. 7 - Prob. 14PSCh. 7 - Portfolio risk To calculate the variance of a...Ch. 7 - Portfolio risk a) How many variance terms and how...Ch. 7 - Portfolio risk Table 7.8 shows standard deviations...Ch. 7 - Portfolio risk Hyacinth Macaw invests 60% of her...Ch. 7 - Stock betas What is the beta of each of the stocks...Ch. 7 - Stock betas There are few, if any, real companies...Ch. 7 - Portfolio betas A portfolio contains equal...Ch. 7 - Portfolio betas Suppose the standard deviation of...Ch. 7 - Portfolio risk Here are some historical data on...Ch. 7 - Portfolio risk Suppose that Treasury bills offer a...
Knowledge Booster


Learn more about
Need a deep-dive on the concept behind this application? Look no further. Learn more about this topic, finance and related others by exploring similar questions and additional content below.Similar questions
- A merchant's position in cash is 10000 bushel of wheat, the variance of the changes of the future price is 0.00094, the variance of the changes of the base is 0.000453, the variance of the changes of the price in cash is 0.000805 and the covariance of the changes of the forward price with the changes of the prices in cash is 0.000518. Calculate the efficiency of the hedge and choose one of the following answers a. 0.97 b. 0.31 c. 0.69 d. 0.03arrow_forwardThe expected annual returns are 15% for investment 1 and 12% for investment 2. The standard deviation of the first investment’s return is 10%; the second investment’s return has a standard deviation of 5%. A.) Which investment is less risky based solely on standard deviation? (Investment 1 or Investment 2)B.) Which investment is less risky based on coefficient of variation? (Investment 1 or Investment 2)C.) Which is a better measure given that the expected returns of the two investments are not the same? (Coefficient of Variation or Standard Deviation)arrow_forwardConsider 2 scenarios: Boom Economy and Normal Economy. The Boom economy has 20% chance of happening, while Normal economy has 80% chance of happening. For each scenario (Boom and Normal), stock ABC has a return of 25%, and 4%, respectively; stock XYZ has a return of 10% and 6.5%, respectively; the market portfolio has a return of 12% and 5% respectively. 1) Calculate Expected return, Variance and Standard deviation for stock ABC and XYZ 2) Based on your results in part (1), can you decide which stock to invest?3) Calculate Beta for stock ABC and XYZ 4) If the T-bill rate is 3%, what does the CAPM say about the fair expected rate of return on the two stocks? How does this result influence your investment decision?arrow_forward
- APT An analyst has modeled the stock of Crisp Trucking using a two-factor APT model. The risk-free rate is 6%, the expected return on the first factor (r1) is 12%, and the expected return on the second factor (r2) is 8%. If bi1 = 0.7 and bi2 = 0.9, what is Crisp’s required return?arrow_forwardSecurity A has an expected rate of return of 6%, a standard deviation of returns of 30%, a correlation coefficient with the market of −0.25, and a beta coefficient of −0.5. Security B has an expected return of 11%, a standard deviation of returns of 10%, a correlation with the market of 0.75, and a beta coefficient of 0.5. Which security is more risky? Why?arrow_forwardConsider a decision maker who is comfortable with an investment decision that has a 50% chance of earning $25,000 and a 50% chance of losing $12,500, but not with any larger investments that have the same relative payoffs. Write the equation for the exponential function that approximates this decision maker’s utility function. Plot the exponential utility function for this decision maker for x values between –20,000 and 35,000. Is this decision maker risk-seeking, risk-neutral, or risk-averse? Suppose the decision maker decides that she would actually be willing to make an investment that has a 50% chance of earning $30,000 and a 50% chance of losing $15,000. Plot the exponential function that approximates this utility function and compare it to the utility function from part (b). Is the decision maker becoming more risk-seeking or more risk-averse?arrow_forward
- A firm has three investment alternatives. Payoffs are in thousands of dollars. a. Using the expected value approach, which decision is preferred? b. For the lottery having a payoff of 100,000 with probability p and 0 with probability (1 p), two decision makers expressed the following indifference probabilities. Find the most preferred decision for each decision maker using the expected utility approach. c. Why dont decision makers A and B select the same decision alternative?arrow_forwardThree decision makers have assessed utilities for the following decision problem (payoff in dollars): The indifference probabilities are as follows: Plot the utility function for money for each decision maker. Classify each decision maker as a risk avoider, a risk taker, or risk-neutral. For the payoff of 20, what is the premium that the risk avoider will pay to avoid risk? What is the premium that the risk taker will pay to have the opportunity of the high payoff?arrow_forwardConsider 2 scenarios: Boom Economy and Normal Economy. The Boom economy has 30% chance of happening, while Normal economy has 70% chance of happening. For each scenario (Boom and Normal), stock ABC has a return of 25%, and 4%, respectively; stock XYZ has a return of 10% and 6.5%, respectively; the market portfolio has a return of 12% and 5% respectively. 1) Calculate Expected return, Variance and Standard deviation for stock ABC and XYZ 2) Based on your results in part (1), can you decide which stock to invest? 3) Calculate Beta for stock ABC and XYZ 4) If the T-bill rate is 3%, what does the CAPM say about the fair expected rate of return on the two stocks? How does this result influence your investment decision?arrow_forward
- Security A has an expected rate of return of 6%, a standard deviation ofreturns of 30%, a correlation coefficient with the market of 20.25, and abeta coefficient of 20.5. Security B has an expected return of 11%, a standard deviation of returns of 10%, a correlation with the market of 0.75, anda beta coefficient of 0.5. Which security is more risky? Why?arrow_forwardAn investment has a 20% chance of producing a 25% return, a 60%chance of producing a 10% return, and a 20% chance of producinga 215% return. What is its expected return? (8%) What is itsstandard deviation? (12.9%)arrow_forwardAssume that the short-term risk-free rate is 3%, the market index S&P500 is expected to pay returns of 15% with the standard deviation equal to 20%. Asset A pays on average 5%, has a standard deviation equal to 20%, and is NOT correlated with the S&P500. Asset B pays on average 8%, also has a standard deviation equal to 20%, and has a correlation of 0.5 with the S&P500. Determine whether asset A and B are overvalued or undervalued, and explain why? the hint is given in image inserted...arrow_forward
arrow_back_ios
SEE MORE QUESTIONS
arrow_forward_ios
Recommended textbooks for you
 Intermediate Financial Management (MindTap Course...FinanceISBN:9781337395083Author:Eugene F. Brigham, Phillip R. DavesPublisher:Cengage Learning
 Essentials of Business Analytics (MindTap Course ...StatisticsISBN:9781305627734Author:Jeffrey D. Camm, James J. Cochran, Michael J. Fry, Jeffrey W. Ohlmann, David R. AndersonPublisher:Cengage Learning
Intermediate Financial Management (MindTap Course...
Finance
ISBN:9781337395083
Author:Eugene F. Brigham, Phillip R. Daves
Publisher:Cengage Learning
Essentials of Business Analytics (MindTap Course ...
Statistics
ISBN:9781305627734
Author:Jeffrey D. Camm, James J. Cochran, Michael J. Fry, Jeffrey W. Ohlmann, David R. Anderson
Publisher:Cengage Learning
Portfolio return, variance, standard deviation; Author: MyFinanceTeacher;https://www.youtube.com/watch?v=RWT0kx36vZE;License: Standard YouTube License, CC-BY