
PRIN.OF CORPORATE FINANCE
13th Edition
ISBN: 9781260013900
Author: BREALEY
Publisher: RENT MCG
expand_more
expand_more
format_list_bulleted
Videos
Textbook Question
Chapter 7, Problem 25PS
Portfolio risk Here are some historical data on the risk characteristics of Ford and Harley Davidson:
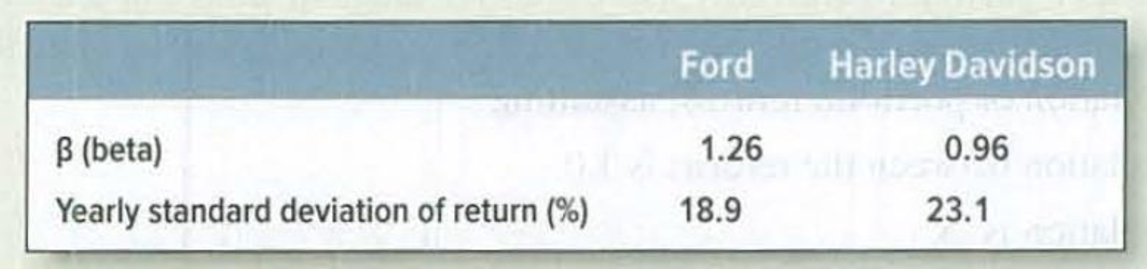
Assume the standard deviation of the return on the market was 9.5%.
- a. The correlation coefficient of Ford’s return versus Harley Davidson is 0.30. What is the standard deviation of a portfolio invested half in each share?
- b. What is the standard deviation of a portfolio invested one-third in Ford, one-third in Harley Davidson, and one-third in risk-free Treasury bills?
- c. What is the standard deviation if the portfolio is split evenly between Ford and Harley Davidson and is financed at 50% margin, that is, the investor puts up only 50% of the total amount and borrows the balance from the broker?
- d. What is the approximate standard deviation of a portfolio composed of 100 stocks with betas of 1.26 like Ford? How about 100 stocks like Harley Davidson? [Hint: Part (d) should not require anything but the simplest arithmetic to answer.]
Expert Solution & Answer
Want to see the full answer?
Check out a sample textbook solution
Students have asked these similar questions
Here are some historical data on the risk characteristics of Ford and Harley Davidson.
Ford
Harley Davidson
β (beta)
1.26
0.69
Yearly standard deviation of return (%)
30.9
16.9
Assume the standard deviation of the return on the market was 12.0%.
a. The correlation coefficient of Ford’s return versus Harley Davidson is 0.27. What is the standard deviation of a portfolio invested half in each share?
b. What is the standard deviation of a portfolio invested one-third in Ford, one-third in Harley Davidson, and one-third in risk-free Treasury bills?
c. What is the standard deviation if the portfolio is split evenly between Ford and Harley Davidson and is financed at 50% margin, that is, the investor puts up only 50% of the total amount and borrows the balance from the broker?
d-1. What is the approximate standard deviation of a portfolio composed of 100 stocks with betas of 1.26 like Ford?
d-2. What is the approximate standard deviation of a portfolio composed of…
An analyst wants to evaluate Portfolio X, consisting entirely of U.S. common stocks, using both the Treynor and Sharpe measures of portfolio performance. The following table provides the average annual rate of return for Portfolio X, the market portfolio (as measured by the Standard and Poor’s 500 Index), and U.S. Treasury bills (T-bills) during the past eight years.
Rate Annual Averageof Return
STANDARD DEVIATION OF RETURN
BETA
Portfolio X
10
13
0.40
S&P 500
12
10
1.00
T-bills
7
n/a
n/a
n/a = not applicable
Calculate both the Treynor measure and the Sharpe measure for both Portfolio X and the S&P 500. Round your answers for the Treynor measure to one decimal place and for the Sharpe measure to three decimal places.
Treynor measure
Sharpe measure
Portfolio X
7.5
S&P 500
5
For the above shares if the expected inter correlations are given as follows:
Investment in RM millions
Weight
Correlation
Petronas
23
?
0.15(P,M)
Maxis
47
?
0.25(M,B)
Berjaya
40
?
0.35(B,P)
d) Compute Weights
e) Compute the expected portfolio return and
f) Expected portfolio risk
g) Portfolio Sharpe ratio
Chapter 7 Solutions
PRIN.OF CORPORATE FINANCE
Ch. 7 - Rate of return The level of the Syldavia market...Ch. 7 - Real versus nominal returns The Costaguana stock...Ch. 7 - Arithmetic average and compound returns Integrated...Ch. 7 - Risk premiums Here are inflation rates and U.S....Ch. 7 - Risk Premium Suppose that in year 2030, investors...Ch. 7 - Stocks vs. bonds Each of the following statements...Ch. 7 - Expected return and standard deviation A game of...Ch. 7 - Standard deviation of returns The following table...Ch. 7 - Average returns and standard deviation During the...Ch. 7 - Prob. 10PS
Ch. 7 - Prob. 11PSCh. 7 - Diversification Here are the percentage returns on...Ch. 7 - Risk and diversification In which of the following...Ch. 7 - Prob. 14PSCh. 7 - Portfolio risk To calculate the variance of a...Ch. 7 - Portfolio risk a) How many variance terms and how...Ch. 7 - Portfolio risk Table 7.8 shows standard deviations...Ch. 7 - Portfolio risk Hyacinth Macaw invests 60% of her...Ch. 7 - Stock betas What is the beta of each of the stocks...Ch. 7 - Stock betas There are few, if any, real companies...Ch. 7 - Portfolio betas A portfolio contains equal...Ch. 7 - Portfolio betas Suppose the standard deviation of...Ch. 7 - Portfolio risk Here are some historical data on...Ch. 7 - Portfolio risk Suppose that Treasury bills offer a...
Knowledge Booster


Learn more about
Need a deep-dive on the concept behind this application? Look no further. Learn more about this topic, finance and related others by exploring similar questions and additional content below.Similar questions
- An analyst has modeled the stock of a company using the Fama-French three-factor model. The market return is 10%, the return on the SMB portfolio (rSMB) is 3.2%, and the return on the HML portfolio (rHML) is 4.8%. If ai = 0, bi = 1.2, ci = 20.4, and di = 1.3, what is the stock’s predicted return?arrow_forwardYou have observed the following returns over time: Assume that the risk-free rate is 6% and the market risk premium is 5%. What are the betas of Stocks X and Y? What are the required rates of return on Stocks X and Y? What is the required rate of return on a portfolio consisting of 80% of Stock X and 20% of Stock Y?arrow_forwardSuppose Johnson & Johnson and the Walgreen Company have expected returns and volatilities shown below, with a correlation of 22%. Calculate the expected return of a portfolio that is equally invested in J&J and Walgreen’s stock. Calculate the volatility (standard deviation) of a portfolio that is equally invested in Johnson & Johnson’s and Walgreen’s stock.arrow_forward
- An analyst wants to evaluate Portfolio X consisting entirely of US common stocks, using both the Treynor and Sharpe measures of the portfolio performance. The following table provides the average annual rate of return for the portfolio X the market portfolio (as measured by the Standard & Poor's 500 index) and US Treasury billds (Tbills) during the past eight years Average Return Standard deviation Beta Portfolio X 10% 18% 0.6 S & P 500 12% 13% 1 T bills 6% n/a n/a a. Calculate both the Treynor measure and the Sharpe measure for both Portfolio X and the S&P 500. Briefly explain whether portfolio X underperformed, equalled, or outperformed the S&P 500 on a risk-adjusted basis using both the Treynor measure and the Sharpe measure. b. Based on the performance of…arrow_forwardThe figures below show plots of monthly rates of return on three stocks versus those of the market index. The beta and standard deviation of each stock is given beside the plot. Consider a well-diversified portfolio composed of stocks with the same beta and standard deviation as Ford. What are the beta and standard deviation of this portfolio’s return? The standard deviation of the market portfolio’s return is 20%. Use the capital asset pricing model to estimate the expected return on each stock. The risk-free rate is 4%, and the market risk premium is 8%.arrow_forwardSuppose Johnson & Johnson and Walgreen Boots Alliance have expected returns and volatilities shown here, with a correlation of 20%. Calculate a. the expected return and b. the volatility(standard deviation) of a portfolio that consists of a long position of $12,000 in Johnson & Johnson and a short position of $2,000 in Walgreens. Expected Return Standard Deviation Johnson & Johnson 7.7% 16.5% Walgreens 9.4% 19.2%arrow_forward
- a) Historical nominal returns for Coca-Cola have been 8% and -20%. The nominal returns for the market index S&P500 over the same periods were -15% and 28%. Calculate the beta for Coca-cola. b) The covariance between stocks A and B is 0.0014, standard deviation of stock A is 0.032, and standard deviation of stock B is 0.044. Which of the following is the most appropriate to depict the risk-return characteristics of a portfolio consisting of only stocks A and B, and explain why? (A) (B) (C) c) Assume that using the Security Market Line (SML) the required rate of return (RA) on stock A is found to be half of the required return (RB) on stock B. The risk-free rate (Rf) is one-fourth of the required return on A. Return on market portfolio is denoted by RM. Find the ratio of beta of A (A) to beta of B (B). d) Assume that the short-term risk-free rate is 3%, the market index S&P500 is expected to pay returns of 15% with the standard deviation equal to 20%. Asset A pays on average…arrow_forward(Expected rate of return and risk) Syntex, Inc. is considering an investment in one of two common stocks. Given the information that follows, which investment is better, based on the risk (as measured by the standard deviation) and return? Common Stock A Common Stock B Probability Return Probability Return0.20 10% 0.15 -4% 0.60 16% 0.35 7%0.20 21% 0.35 13% 0.15 20% a) Syntex, Inc. is considering an investment in one of two common stocks. Given the information that follows, what is the expected rate of return for stock A? What is the standard deviation? b. Syntex, Inc. is considering an investment in one of two common stocks. Given the information that follows, what is the expected rate of return for stock B? What is the standard deviation? c. Based on the risk (as measured by the standard deviation) and return of each stock, which…arrow_forwardConsider a portfolio consisting of the three risky stocks. You decide to invest 25 percent in Apple, 35 percent in HP and 40 percent in Spree. These stocks show the volatility at the level of 11.15 percent, 24.4 percent and 15.29 percent, and the correlation with the market portfolio at the level of 0.65, 0.83 and 0.36, respectively. Calculate the expected portfolio return using CAPM if the market portfolio shows the expected return of 12.88 percent and its volatility is 10.05 percent. The risk-free rate of return is 3.31 percent. Please make sure your answer is correct tutor. Out of my questions in Bartleby, 90% are wrong all the time. Which is resulting also to my low grades. Don't get it if you don't know the answer. Please use TEXT. not snip or handwriting. Thank youarrow_forward
arrow_back_ios
arrow_forward_ios
Recommended textbooks for you
 EBK CONTEMPORARY FINANCIAL MANAGEMENTFinanceISBN:9781337514835Author:MOYERPublisher:CENGAGE LEARNING - CONSIGNMENT
 Intermediate Financial Management (MindTap Course...FinanceISBN:9781337395083Author:Eugene F. Brigham, Phillip R. DavesPublisher:Cengage Learning
 Financial Reporting, Financial Statement Analysis...FinanceISBN:9781285190907Author:James M. Wahlen, Stephen P. Baginski, Mark BradshawPublisher:Cengage Learning
EBK CONTEMPORARY FINANCIAL MANAGEMENT
Finance
ISBN:9781337514835
Author:MOYER
Publisher:CENGAGE LEARNING - CONSIGNMENT
Intermediate Financial Management (MindTap Course...
Finance
ISBN:9781337395083
Author:Eugene F. Brigham, Phillip R. Daves
Publisher:Cengage Learning
Financial Reporting, Financial Statement Analysis...
Finance
ISBN:9781285190907
Author:James M. Wahlen, Stephen P. Baginski, Mark Bradshaw
Publisher:Cengage Learning
Chapter 8 Risk and Return; Author: Michael Nugent;https://www.youtube.com/watch?v=7n0ciQ54VAI;License: Standard Youtube License