
PRIN.OF CORPORATE FINANCE
13th Edition
ISBN: 9781260013900
Author: BREALEY
Publisher: RENT MCG
expand_more
expand_more
format_list_bulleted
Videos
Textbook Question
Chapter 7, Problem 9PS
Average returns and standard deviation During the boom years of 2010–2014, ace mutual fund manager Diana Sauros produced the following percentage
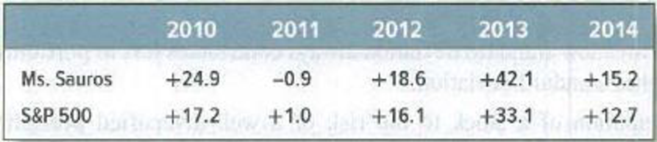
Calculate the average return and standard deviation of Ms. Sauros’s mutual fund. Did she do better or worse than the market by these measures?
Expert Solution & Answer
Want to see the full answer?
Check out a sample textbook solution
Students have asked these similar questions
In a recent 5tear period, mutual fund manager Diana sharks produced the following percentage rates of return for the Mesozoic fund. Rates of return on the market index are given for comparison.
A. Calculate the average return on both the fund and the index and the standard deviation of the returns on each. Did Ms. Sauros do better or worse than the market index on these measures?
Last year, two mutual funds, OHH and FLL, reported the same return and standard deviation, but OHH's beta was higher than FLL's beta. Based on the Sharpe measure, which mutual fund performed better last year?
A. FLL
B. OHH
C. They had the same performance.
D. Undetermined because their alphas are unknown.
In a recent 5-year period, mutual fund manager Diana Sauros produced the following percentage rates of return for the Mesozoic Fund. Rates of return on the market index are given for comparison.
1
2
3
4
5
Fund
−1.3
+23.9
+41.8
+10.8
+0.4
Market index
−0.6
+15.0
+31.3
+9.8
−0.8
a. Calculate (a) the average return on both the Fund and the index, and (b) the standard deviation of the returns on each. (Do not round intermediate calculations. Round your answers to 2 decimal places.)
b. Did Ms. Sauros do better or worse than the market index on these measures?
Chapter 7 Solutions
PRIN.OF CORPORATE FINANCE
Ch. 7 - Rate of return The level of the Syldavia market...Ch. 7 - Real versus nominal returns The Costaguana stock...Ch. 7 - Arithmetic average and compound returns Integrated...Ch. 7 - Risk premiums Here are inflation rates and U.S....Ch. 7 - Risk Premium Suppose that in year 2030, investors...Ch. 7 - Stocks vs. bonds Each of the following statements...Ch. 7 - Expected return and standard deviation A game of...Ch. 7 - Standard deviation of returns The following table...Ch. 7 - Average returns and standard deviation During the...Ch. 7 - Prob. 10PS
Ch. 7 - Prob. 11PSCh. 7 - Diversification Here are the percentage returns on...Ch. 7 - Risk and diversification In which of the following...Ch. 7 - Prob. 14PSCh. 7 - Portfolio risk To calculate the variance of a...Ch. 7 - Portfolio risk a) How many variance terms and how...Ch. 7 - Portfolio risk Table 7.8 shows standard deviations...Ch. 7 - Portfolio risk Hyacinth Macaw invests 60% of her...Ch. 7 - Stock betas What is the beta of each of the stocks...Ch. 7 - Stock betas There are few, if any, real companies...Ch. 7 - Portfolio betas A portfolio contains equal...Ch. 7 - Portfolio betas Suppose the standard deviation of...Ch. 7 - Portfolio risk Here are some historical data on...Ch. 7 - Portfolio risk Suppose that Treasury bills offer a...
Knowledge Booster


Learn more about
Need a deep-dive on the concept behind this application? Look no further. Learn more about this topic, finance and related others by exploring similar questions and additional content below.Similar questions
- You have been given the following return information for two mutual funds (Papa and Mama), the market index, and the risk-free rate. Year Papa Fund Mama Fund Market Risk-Free 2011 –12.6 % –22.6 % –24.5 % 1 % 2012 25.4 18.5 19.5 3 2013 8.5 9.2 9.4 2 2014 15.5 8.5 7.6 4 2015 2.6 –1.2 –2.2 2 Calculate the Sharpe ratio, Treynor ratio, Jensen’s alpha, information ratio, and R-squared for both funds. (Input all amounts as positive values. Do not round intermediate calculations. Enter all answers as a decimal value rounded to 4 decimal places.) PAPA MAMA SHARPE RATIO: TREYNOR RATIO JENSEN'S ALPHA INFORMATION RATIO R-SQUAREDarrow_forward"The following table gives the rate of return for a certain mutual fund from 2010 to 2014: Year Rate of Return 2010 -5.9% 2011 11.4% 2012 1.4% 2013 12.7% 2014 6.5% Compute the overall rate of return during this period. Round your answer to the nearest tenth of a percent."arrow_forwardUse the following data to answer the question regarding the performance of Guardian Stock Fund and the market portfolio. The risk-free return during the sample period was 4%. Guardian Market Portfolio Average return 14 % 10 % Standard deviation of returns 27 % 21 % Beta 1.5 1 Residual standard deviation 4 % 0 % Calculate the information ratio measure of performance for Guardian Stock Fund. (Round your answer to 2 decimal places. Do not round intermediate calculations.)arrow_forward
- You are given the following information concerning several mutual funds: Fund Return in Excess of the Treasury Bill Rate Beta A 12.4% 1.14 B 13.2% 1.22 C 11.4% 0.90 D 9.8% 0.76 E 12.6% 0.95 During the time period, the Standard & Poor's stock index exceeded the Treasury bill rate by 10.5 percent (i.e., r(m) - r(f) = 10.5%) a. Rank the performance of each fund without adjusting for risk and adjusting for risk using the Treynor index. Which, if any, outperformed the market? (Remember, the beta of the market is 1.0.) b. The analysis in part (a) assumes each fund is sufficiently diversified so that the appropriate measure of risk is the beta coefficient. Suppose,…arrow_forwardYou are tasked with comparing two Icelandic equity funds. The other fund is called the RU IS Equity Fund (RIS). The other fund is called HÍ IS Equity Fund (HIS). It is known that the funds had the following ratios in certain shares over the period 2018 to 2021 (it is not assumed that they received dividends during the period). The proportions did not change over the period. The price of individual shares over the period can be found in the red box down below the text. a) What was the average annual return of RIS and HIS over the periodarrow_forwardInvestments are made to earn a return, but making investments requires the individual to bear risk. A higher return by itself does not necessarily indicate superior performance. It may simply be the result of taking more risk. Given this context, answer the following two-part questions. A mutual fund generates a 10.8 percent return. During the same period, the market rose by 8.8 percent. If the risk-free rate was 2 percent and the fund had a beta of 1.2 : Did the fund outperform the market? Explain your response.arrow_forward
- The following data relates to the portfolios of a fund’s two equity managers Total Return Beta Manager A 24 % 1.0 Manager B 30.0 % 1.5 S&P 500 21.0 Lehman 31.0 91 day Treasury bills 12.0 Calculate and compare the risk-adjusted performance of the two managers relative to each other and to the S&P 500. Explain the reasons why the conclusions drawn from this calculation may be misleading.arrow_forwardThe following data are available relating to the performacne of Long Horn Stock Fund and the market portfolio: Long Horn Market Portfolio Average return 19% 12% Standard Deviation of returns 35% 15% Beta 1.5 1.0 Residual standard deviation 3.0% 0.0% The risk-free return during the sample period was 4%. A. What is the sharpe measure of performance evaluation for long horn stock fund? B. What is the treynor measure of performance evaluation for long horn stock fund? C. Calculate the jensen measure of performance evaluation for long horn stock fund. D. Calculate the information ratio of performance evaluation for long horn stock fund.arrow_forwardYou have been given the following return information for a mutual fund, the market index, and the risk-free rate. You also know that the return correlation between the fund and the market is .97. Year Fund Market Risk-Free 2015 −18.20 % −35.50 % 2 % 2016 25.10 20.60 5 2017 13.50 12.70 2 2018 6.80 8.40 6 2019 −1.86 −4.20 3 Calculate Jensen’s alpha for the fund, as well as its information ratio. (Do not round intermediate calculations. Enter the alpha as a percent rounded to 2 decimal places. Round the ratio to 4 decimal places.)arrow_forward
- If you desire to forecast performance of a mutual fund for next year, the best forecast will be given by the a. geometric average return b. neither geometric average return nor arithmetic average return c. arithmetic average return d. both geometric average return and arithmetic average return You buy and hold a S&P 500 index fund. You always reinvest your dividends earned on the fund. Which method provides the best measure of the actual average historical performance of the investments you have chosen? a. both geometric average return and arithmetic average return b. neither geometric average return nor arithmetic average return c. arithmetic average return d. geometric average returnarrow_forwardWhich of the following hypothetical phenomena would be either consistent with or a violation of the efficient market hypothesis? a. Nearly half of all professionally managed mutual funds are able to outperform the S&P 500 in a typical year. Consistent Inconsistent b. Money managers who outperform the market (on a risk-adjusted basis) in one year are likely to outperform the market in the following year. Consistent Inconsistent c. Stock prices tend to be predictably more volatile in January than in other months. Consistent Inconsistent d. Stock prices of companies that announce increased earnings in January tend to outperform the market in February. Consistent Inconsistentarrow_forwardFinance Consider the following information for a mutual fund, the market index, and the risk-free rate. You also know that the return correlation between the fund and the market is 0.89. Year Fund Market Risk-Free 2008 -21.2 % -40.5 % 2 % 2009 25.1 21.1 4 2010 14 14.2 2 2011 6.2 8.8 4 2012 -2.16 -5.2 3 What are the Sharpe and Treynor ratios for the fund? (Round your answer to 4 decimal places.) Treynor ratio 2. Refer to the table below. 3 Doors, Inc. Down Co. Expected return, E (R) 16 % 9.5 % Standard deviation, σ 31 19 Correlation .40 Using the information provided on the two stocks in the table above, find the expected return and standard deviation on the minimum variance portfolio. (Round your answer to 2 decimal places. Omit the "%" sign in your response.) Expected Return % Expected return 3. Consider the following…arrow_forward
arrow_back_ios
SEE MORE QUESTIONS
arrow_forward_ios
Recommended textbooks for you
 Essentials Of InvestmentsFinanceISBN:9781260013924Author:Bodie, Zvi, Kane, Alex, MARCUS, Alan J.Publisher:Mcgraw-hill Education,

 Foundations Of FinanceFinanceISBN:9780134897264Author:KEOWN, Arthur J., Martin, John D., PETTY, J. WilliamPublisher:Pearson,
 Fundamentals of Financial Management (MindTap Cou...FinanceISBN:9781337395250Author:Eugene F. Brigham, Joel F. HoustonPublisher:Cengage Learning
 Corporate Finance (The Mcgraw-hill/Irwin Series i...FinanceISBN:9780077861759Author:Stephen A. Ross Franco Modigliani Professor of Financial Economics Professor, Randolph W Westerfield Robert R. Dockson Deans Chair in Bus. Admin., Jeffrey Jaffe, Bradford D Jordan ProfessorPublisher:McGraw-Hill Education
Essentials Of Investments
Finance
ISBN:9781260013924
Author:Bodie, Zvi, Kane, Alex, MARCUS, Alan J.
Publisher:Mcgraw-hill Education,
Foundations Of Finance
Finance
ISBN:9780134897264
Author:KEOWN, Arthur J., Martin, John D., PETTY, J. William
Publisher:Pearson,
Fundamentals of Financial Management (MindTap Cou...
Finance
ISBN:9781337395250
Author:Eugene F. Brigham, Joel F. Houston
Publisher:Cengage Learning
Corporate Finance (The Mcgraw-hill/Irwin Series i...
Finance
ISBN:9780077861759
Author:Stephen A. Ross Franco Modigliani Professor of Financial Economics Professor, Randolph W Westerfield Robert R. Dockson Deans Chair in Bus. Admin., Jeffrey Jaffe, Bradford D Jordan Professor
Publisher:McGraw-Hill Education
Chapter 8 Risk and Return; Author: Michael Nugent;https://www.youtube.com/watch?v=7n0ciQ54VAI;License: Standard Youtube License