
PRIN.OF CORPORATE FINANCE
13th Edition
ISBN: 9781260013900
Author: BREALEY
Publisher: RENT MCG
expand_more
expand_more
format_list_bulleted
Concept explainers
Videos
Textbook Question
Chapter 7, Problem 8PS
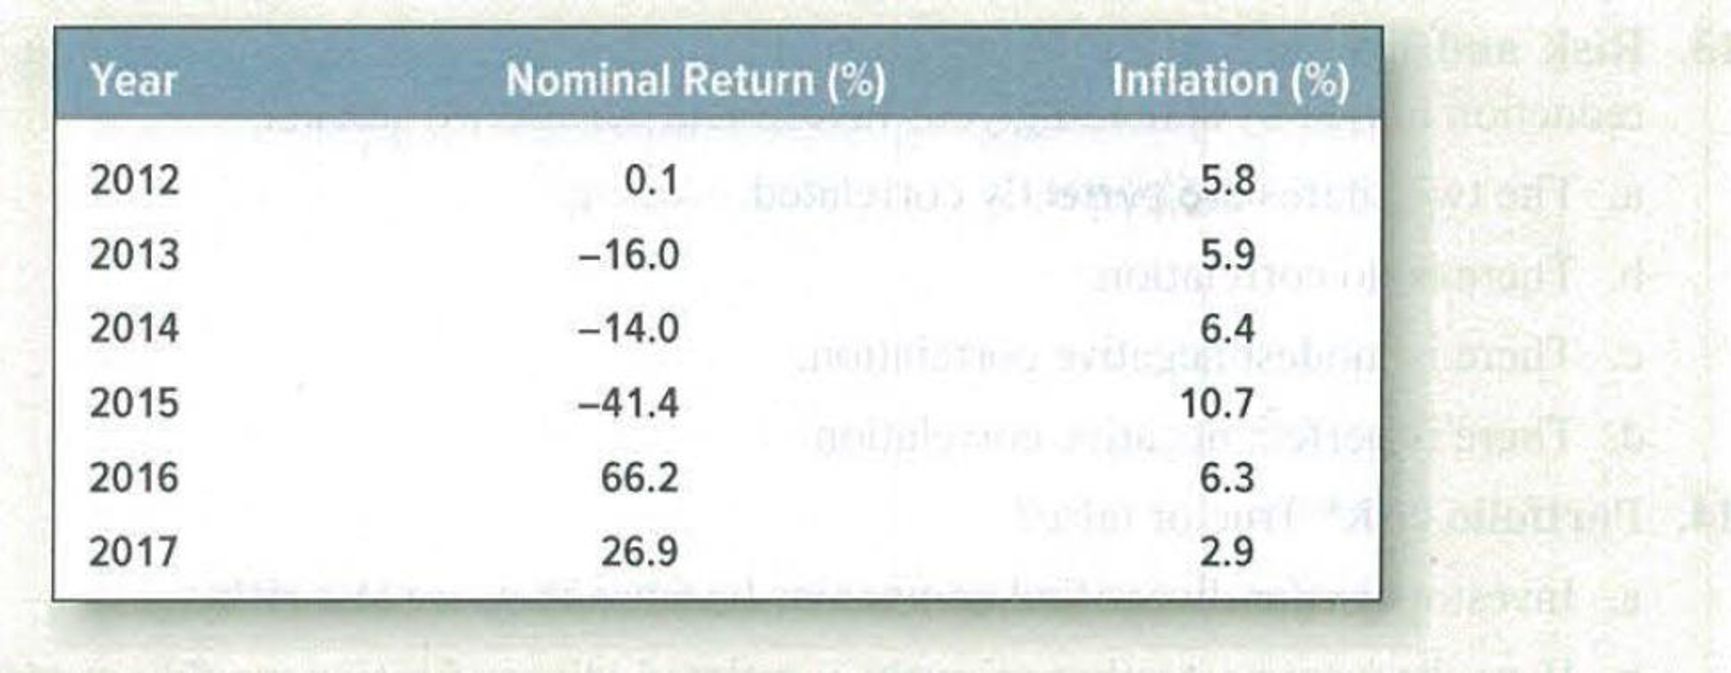
Standard deviation of returns The following table shows the nominal returns on Brazilian stocks and the rate of inflation.
- a. What was the standard deviation of the market returns? (Do not make the adjustment for degrees of freedom described in footnote 15.)
- b. Calculate the average real return.
Expert Solution & Answer
Want to see the full answer?
Check out a sample textbook solution
Students have asked these similar questions
The following table shows the nominal returns on Brazilian stocks and the rate of inflation.
Year
Nominal Return (%)
Inflation (%)
2012
0.3
6.3
2013
-16.0
6.4
2014
-14.0
6.9
2015
-41.9
11.2
2016
66.7
6.8
2017
27.4
3.4
a. What was the standard deviation of the market returns? (Use decimals, not percents, in your calculations. Do not round intermediate calculations. Enter your answer as a percent rounded to 2 decimal places.)
b. Calculate the average real return. (A negative answer should be indicated by a minus sign. Do not round intermediate calculations. Enter your answer as a percent rounded to 2 decimal places)
Use the following information on states of the economy and stock returns to calculate the standard deviation of returns. (Do not round intermediate calculations. Enter your answer as a percent rounded to 2 decimal places.)
State of Economy
Probability ofState of Economy
Security Returnif State Occurs
Recession
0.40
−4.50
%
Normal
0.50
13.00
Boom
0.10
25.00
The following table shows the nominal returns on Brazilian stocks and the rate of inflation.
Year
Nominal Return (%)
Inflation (%)
2012
0.3
7.1
2013
-13.0
7.2
2014
-11.0
7.7
2015
-42.7
12.0
2016
67.5
7.6
2017
28.2
4.2
Calculate the average real return. (A negative answer should be indicated by a minus sign. Do not round intermediate calculations. Enter your answer as a percent rounded to 2 decimal places)
Chapter 7 Solutions
PRIN.OF CORPORATE FINANCE
Ch. 7 - Rate of return The level of the Syldavia market...Ch. 7 - Real versus nominal returns The Costaguana stock...Ch. 7 - Arithmetic average and compound returns Integrated...Ch. 7 - Risk premiums Here are inflation rates and U.S....Ch. 7 - Risk Premium Suppose that in year 2030, investors...Ch. 7 - Stocks vs. bonds Each of the following statements...Ch. 7 - Expected return and standard deviation A game of...Ch. 7 - Standard deviation of returns The following table...Ch. 7 - Average returns and standard deviation During the...Ch. 7 - Prob. 10PS
Ch. 7 - Prob. 11PSCh. 7 - Diversification Here are the percentage returns on...Ch. 7 - Risk and diversification In which of the following...Ch. 7 - Prob. 14PSCh. 7 - Portfolio risk To calculate the variance of a...Ch. 7 - Portfolio risk a) How many variance terms and how...Ch. 7 - Portfolio risk Table 7.8 shows standard deviations...Ch. 7 - Portfolio risk Hyacinth Macaw invests 60% of her...Ch. 7 - Stock betas What is the beta of each of the stocks...Ch. 7 - Stock betas There are few, if any, real companies...Ch. 7 - Portfolio betas A portfolio contains equal...Ch. 7 - Portfolio betas Suppose the standard deviation of...Ch. 7 - Portfolio risk Here are some historical data on...Ch. 7 - Portfolio risk Suppose that Treasury bills offer a...
Knowledge Booster


Learn more about
Need a deep-dive on the concept behind this application? Look no further. Learn more about this topic, finance and related others by exploring similar questions and additional content below.Similar questions
- What is the standard deviation of the returns on a stock given the following information? State of Economy Probability of State of Economy Rate of Return if State Occurs Boom .08 .171 Normal .70 .076 Recession .22 .017arrow_forward(Inflation and Interest Rates) What would you expect the nominal rate of interest to be if the real rate is 4 percent and the expected inflation rate is 7 percent? (Expected Rate of Return and Risk) Syntex, Inc. is considering an investment in one of two common stocks. Given the information that follows, which investment is better, based on risk (as measured by the standard deviation) and return? Common Stock A Common Stock B Probability Return Probability Return .30 11% .20 25% .40 15% .30 6% .30 19% .30 14% .20 22% (Common Stock Valuation) Header Motor, Inc., paid a $3.50 dividend last year. At a constant growth rate of 5 percent, what is the value of the common stock if the investors require a 20-percent rate of return? (Preferred Stock Valuation) What is the value of a preferred stock where the dividend rate is 14 percent on a $100 par value? The appropriate discount rate for a stock of this…arrow_forwardThe following four macro-economic factors were identified regarding a stock As returns, the stock sensitivity to each factor and the related risk premium associated with each factor have been calculated as follows: Gross domestic product (GDP) growth=0.6 RP=4% Inflation rate= 0.8, RP=2% Platinum prices=-0.7, RP= 5% Standard and Poor’s 500 index return= 1.3 RP=9% The risk free rate is 3% Calculate the expected rate of return using the Arbitrage pricing theory formula.arrow_forward
- Suppose your expectations regarding the stock price are as follows: State of the Market Probability Ending Price HPR (including dividends) Boom 0.35 $140 44.5% Normal growth 0.30 110 14.0 Recession 0.35 80 -16.5 Use the following equations to compute the mean and standard deviation of the HPR on stocks:arrow_forwardAn investment Analysist provide the following data regarding the possible future returns on AmDa’s common stock State of economy Probability ReturnRecession 0.25 -1.4%Normal 0.45 9.4%Boom 0.30 15.4%i. Compute the expected return on the security? ii. Compute the standard deviation on the security? iii. Compute the Coefficient of variationarrow_forwardAssume these were the inflation rates and U.S. stock market and Treasury bill returns between 1929 and 1933: Year Inflation(%) Stock Market Return(%) T-Bill Return(%) 1929 0.5 –13.2 6.1 1930 –5.5 –30.7 2.9 1931 –9.3 –47.6 1.5 1932 –13.2 –8.2 0.8 1933 0.9 64.2 0.6 What was the real return on the stock market in each year? What was the average real return? What was the risk premium in each year? What was the average risk premium?arrow_forward
- Suppose that the Treasury bill rate is 9% rather than 6%, as we assumed in Table 12.1, and the expected return on the market is 11%. Use the betas in that table to answer the following questions. a. Recalculate the expected return on the stocks in Table 12.1. (Do not round intermediate calculations. Enter your answer as a percent rounded to 1 decimal place.) b. Suppose now that you continued to assume that the expected return on the market remained at 11%. Now, what would be the expected returns on each stock? (Do not round intermediate calculations. Enter your answer as a percent rounded to 1 decimal place.)arrow_forwardUse the following output from a market model regression of the weekly percentage returns on the AIG commodities index on a market index to answer questions a. - f. a. What is the formula for the Commodities Index' characteristic line? b. You forecast a market return of 1.0% for next week. What is next week's expected return for the commodities index? c. What is the correlation between the return on the commodities index and the return on the market Index? d. How much of the variation in the commodities index's returns are explained by the model? e. Based on these regression results, the commodities index would be considered what kind of an investment? f. Does this regression have much explanatory power? Why or why not?arrow_forwardSuppose that the Treasury bill rate is 7% rather than 5%, as we assumed in Table 12.1, and the expected return on the market is 11%. Use the betas in that table to answer the following questions. b. Recalculate the expected return on the stocks in Table 12.1. (Do not round intermediate calculations. Enter your answer as a percent rounded to 1 decimal place.) c. Suppose now that you continued to assume that the expected return on the market remained at 11%. Now what would be the expected returns on each stock? (Do not round intermediate calculations. Enter your answer as a percent rounded to 1 decimal place.)arrow_forward
- Given the following information, what is the expected return and standard deviation for this stock? State of Economy Probability Of State of Economy Rate of Return Boom 0.40 25% Recession 0.60 5%arrow_forwardBased on the following information, what is the standard deviation of returns? State of Economy Probability of Stateof Economy Rate of Return ifState Occurs Recession .28 − .096 Normal .41 .111 Boom .31 .221arrow_forwardAssume these are the stock market and Treasury bill returns for a 5-year period: Required: a. What was the risk premium on common stock in each year? b. What was the average risk premium? c. What was the standard deviation of the risk premium? (Ignore that the estimation is from a sample of data.)arrow_forward
arrow_back_ios
SEE MORE QUESTIONS
arrow_forward_ios
Recommended textbooks for you

Foreign Exchange Risks; Author: Kaplan UK;https://www.youtube.com/watch?v=ne1dYl3WifM;License: Standard Youtube License