Statistics for Engineers and Scientists
4th Edition
ISBN: 9780073530789
Author: Navidi
Publisher: MCG
expand_more
expand_more
format_list_bulleted
Concept explainers
Videos
Textbook Question
Chapter 7.4, Problem 10E
Two radon detectors were placed in different locations in the basement of a home. Each provided an hourly measurement of the radon concentration, in units of pCi/L. The data are presented in the following table.
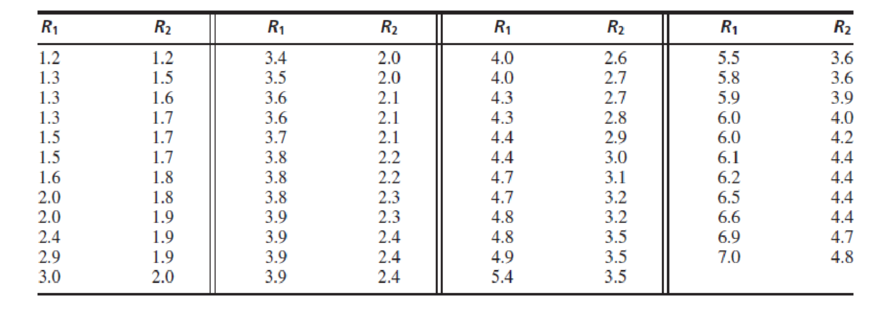
- a. Compute the least-squares line for predicting the radon concentration at location 2 from the concentration at location 1.
- b. Plot the residuals versus the fitted values. Does the linear model seem appropriate?
- c. Divide the data into two groups: points where R1 < 4 in one group, points where R1 ≥ 4 in the other. Compute the least-squares line and the residual plot for each group. Does the line describe either group well? Which one?
- d. Explain why it might be a good idea to fit a linear model to part of these data, and a nonlinear model to the other.
Expert Solution & Answer
Want to see the full answer?
Check out a sample textbook solution
Students have asked these similar questions
A researcher notes that, in a certain region, a disproportionate number of software millionaires were born around the year 1955. Is this a coincidence, or does birth year matter when gauging whether a software founder will besuccessful? The researcher investigated this question by analyzing the data shown in the accompanying table. Complete parts a through c below.
a. Find the coefficient of determination for the simple linear regression model relating number (y) of software millionaire birthdays in a decade to total number (x) of births in the region. Interpret the result.
The coefficient of determination is 1.___?
(Round to three decimal places as needed.)
This value indicates that 2.____ of the sample variation in the number of software millionaire birthdays is explained by the
linear relationship with the total number of births in the region.
(Round to one decimal place as needed.)
b. Find the coefficient of determination for the simple linear regression model…
For a sample of 8 employees, a personnel director has collected the following data on ownership of company stock, y, versus years with the firm, x.
X
6
12
14
6
9
13
15
9
Y
300
408
560
252
288
650
630
522
(a) Determine the least-squares regression line and interpret its slope(b) For an employee who has been with the firm 10 years, what is the predicted number of shares owned?
(c) Is there a statistical significance between years of service and ownership of company stocks? (use α=0.05α=0.05)
The operations manager of a musical instrument distributor feels that demand for a particular type of guitar may be related to the number of YouTube views for a music video by the popular rock group Marble Pumpkins during the preceding month. The manager has collected the data shown in the following table:
YouTube views (1,000s)
Guitar Sales
30
8
40
11
70
12
60
10
80
15
50
13
a. Using the equations presented in this chapter, compute the SST, SSE, and SSR. Find the least-squares regression line for these data (use manual computations)
b. Using the regression equation, predict guitar sales if there were 40,000 views last month (use manual computations)
Chapter 7 Solutions
Statistics for Engineers and Scientists
Ch. 7.1 - Compute the correlation coefficient for the...Ch. 7.1 - For each of the following data sets, explain why...Ch. 7.1 - For each of the following scatterplots, state...Ch. 7.1 - True or false, and explain briefly: a. If the...Ch. 7.1 - In a study of ground motion caused by earthquakes,...Ch. 7.1 - A chemical engineer is studying the effect of...Ch. 7.1 - Another chemical engineer is studying the same...Ch. 7.1 - Tire pressure (in kPa) was measured for the right...Ch. 7.1 - Prob. 10ECh. 7.1 - The article Drift in Posturography Systems...
Ch. 7.1 - Prob. 12ECh. 7.1 - Prob. 13ECh. 7.1 - A scatterplot contains four points: (2, 2), (1,...Ch. 7.2 - Each month for several months, the average...Ch. 7.2 - In a study of the relationship between the Brinell...Ch. 7.2 - A least-squares line is fit to a set of points. If...Ch. 7.2 - Prob. 4ECh. 7.2 - In Galtons height data (Figure 7.1, in Section...Ch. 7.2 - In a study relating the degree of warping, in mm....Ch. 7.2 - Moisture content in percent by volume (x) and...Ch. 7.2 - The following table presents shear strengths (in...Ch. 7.2 - Structural engineers use wireless sensor networks...Ch. 7.2 - The article Effect of Environmental Factors on...Ch. 7.2 - An agricultural scientist planted alfalfa on...Ch. 7.2 - Curing times in days (x) and compressive strengths...Ch. 7.2 - Prob. 13ECh. 7.2 - An engineer wants to predict the value for y when...Ch. 7.2 - A simple random sample of 100 men aged 2534...Ch. 7.2 - Prob. 16ECh. 7.3 - A chemical reaction is run 12 times, and the...Ch. 7.3 - Structural engineers use wireless sensor networks...Ch. 7.3 - Prob. 3ECh. 7.3 - Prob. 4ECh. 7.3 - Prob. 5ECh. 7.3 - Prob. 6ECh. 7.3 - The coefficient of absorption (COA) for a clay...Ch. 7.3 - Prob. 8ECh. 7.3 - Prob. 9ECh. 7.3 - Three engineers are independently estimating the...Ch. 7.3 - In the skin permeability example (Example 7.17)...Ch. 7.3 - Prob. 12ECh. 7.3 - In a study of copper bars, the relationship...Ch. 7.3 - Prob. 14ECh. 7.3 - In the following MINITAB output, some of the...Ch. 7.3 - Prob. 16ECh. 7.3 - In order to increase the production of gas wells,...Ch. 7.4 - The following output (from MINITAB) is for the...Ch. 7.4 - The processing of raw coal involves washing, in...Ch. 7.4 - To determine the effect of temperature on the...Ch. 7.4 - The depth of wetting of a soil is the depth to...Ch. 7.4 - Good forecasting and control of preconstruction...Ch. 7.4 - The article Drift in Posturography Systems...Ch. 7.4 - Prob. 7ECh. 7.4 - Prob. 8ECh. 7.4 - A windmill is used to generate direct current....Ch. 7.4 - Two radon detectors were placed in different...Ch. 7.4 - Prob. 11ECh. 7.4 - The article The Selection of Yeast Strains for the...Ch. 7.4 - Prob. 13ECh. 7.4 - The article Characteristics and Trends of River...Ch. 7.4 - Prob. 15ECh. 7.4 - The article Mechanistic-Empirical Design of...Ch. 7.4 - An engineer wants to determine the spring constant...Ch. 7 - The BeerLambert law relates the absorbance A of a...Ch. 7 - Prob. 2SECh. 7 - Prob. 3SECh. 7 - Refer to Exercise 3. a. Plot the residuals versus...Ch. 7 - Prob. 5SECh. 7 - The article Experimental Measurement of Radiative...Ch. 7 - Prob. 7SECh. 7 - Prob. 8SECh. 7 - Prob. 9SECh. 7 - Prob. 10SECh. 7 - The article Estimating Population Abundance in...Ch. 7 - A materials scientist is experimenting with a new...Ch. 7 - Monitoring the yield of a particular chemical...Ch. 7 - Prob. 14SECh. 7 - Refer to Exercise 14. Someone wants to compute a...Ch. 7 - Prob. 16SECh. 7 - Prob. 17SECh. 7 - Prob. 18SECh. 7 - Prob. 19SECh. 7 - Use Equation (7.34) (page 545) to show that 1=1.Ch. 7 - Use Equation (7.35) (page 545) to show that 0=0.Ch. 7 - Prob. 22SECh. 7 - Use Equation (7.35) (page 545) to derive the...
Additional Math Textbook Solutions
Find more solutions based on key concepts
To explain would this correlation increase, decrease or not change much if we remove the elephants.
Statistics Through Applications
Use the model developed in Example 1.5 to predict the total sales for weeks 2 through 16, and compare the resul...
Business Analytics
Alvie Singer lives at 0 in the accompanying diagram and has four friends who live at A, B, C, and D. One day Al...
Probability and Statistics for Engineering and the Sciences
In Hamilton County, Ohio, the mean number of days needed to sell a house is 86 days (Cincinnati Multiple Listin...
STATISTICS F/BUSINESS+ECONOMICS-TEXT
c
Solve.
70. Copy Center Account. Rachel’s copy-center bill for July was $327. She made a payment of $200 and t...
Developmental Mathematics (9th Edition)
AVX Home Entertainment, Inc., recently began a “no-hassles” return policy. A sample of 500 customers who recent...
EBK STATISTICAL TECHNIQUES IN BUSINESS
Knowledge Booster


Learn more about
Need a deep-dive on the concept behind this application? Look no further. Learn more about this topic, statistics and related others by exploring similar questions and additional content below.Similar questions
- (g) Compute the sum of the squared residuals for the least-squares regression line found in part (d).arrow_forwardCompute the least- squares regression line for the given data set: x 1 2 3 4 5 y 5 6 9 8 7arrow_forwardThe data below represent commute times (in minutes) and scores on a well-being survey. Commute Time (minutes), x 5 15 30 40 50 84 105 Well-Being Index Score, y 68.9 67.6 65.8 64.9 64.0 61.5 58.8 Treating the commute time, x, as the explanatory variable and the index score, y, as the response variable, the least-squares regression line is y = −0.096x + 68.992.arrow_forward
- In general, what is true about the relationship between the Sum of Squared Residuals in the restricted and unrestricted model? a. SSRr < SSRur b. SSRr > SSRur c. SSRr = SSRur d. SSRr = R-squared * SSRurarrow_forwardSuppose Wesley is a marine biologist who is interested in the relationship between the age and the size of male Dungeness crabs. Wesley collects data on 1,000 crabs and uses the data to develop the following least-squares regression line where ? is the age of the crab in months and ?̂ is the predicted value of ?, the size of the male crab in cm. ?̂=8.2052+0.5693? What is the value of ?̂ when a male crab is 21.7865 months old? Provide your answer with precision to two decimal placearrow_forwardA security firm wants to renew the uniforms used by his personnel. It starts by collecting data on their height and weight. The following data was collected from the 19 employees Height (cm) Weight (kg) 168 72 175 88 167 84 171 87 161 67 164 55 177 82 170 60 167 60 184 77 183 98 163 53 186 77 165 64 173 89 161 65 179 77 169 64 174 87 a). Construct an equation to relate these variables, using the least-squares method to determine the regression coefficients, b0 and b1. b). Interpret the meaning of b0 and b1 in this problem. c) determine the coefficient of determination, r2 and interpret its meaning.arrow_forward
arrow_back_ios
arrow_forward_ios
Recommended textbooks for you
 Linear Algebra: A Modern IntroductionAlgebraISBN:9781285463247Author:David PoolePublisher:Cengage Learning
 Glencoe Algebra 1, Student Edition, 9780079039897...AlgebraISBN:9780079039897Author:CarterPublisher:McGraw Hill
 Big Ideas Math A Bridge To Success Algebra 1: Stu...AlgebraISBN:9781680331141Author:HOUGHTON MIFFLIN HARCOURTPublisher:Houghton Mifflin Harcourt
Linear Algebra: A Modern Introduction
Algebra
ISBN:9781285463247
Author:David Poole
Publisher:Cengage Learning
Glencoe Algebra 1, Student Edition, 9780079039897...
Algebra
ISBN:9780079039897
Author:Carter
Publisher:McGraw Hill
Big Ideas Math A Bridge To Success Algebra 1: Stu...
Algebra
ISBN:9781680331141
Author:HOUGHTON MIFFLIN HARCOURT
Publisher:Houghton Mifflin Harcourt
Correlation Vs Regression: Difference Between them with definition & Comparison Chart; Author: Key Differences;https://www.youtube.com/watch?v=Ou2QGSJVd0U;License: Standard YouTube License, CC-BY
Correlation and Regression: Concepts with Illustrative examples; Author: LEARN & APPLY : Lean and Six Sigma;https://www.youtube.com/watch?v=xTpHD5WLuoA;License: Standard YouTube License, CC-BY