
Connect Access Card for Statistics for Engineers and Scientists
4th Edition
ISBN: 9780073518237
Author: William Navidi
Publisher: McGraw-Hill Education
expand_more
expand_more
format_list_bulleted
Concept explainers
Videos
Textbook Question
Chapter 8, Problem 11SE
The data presented in the following table give the tensile strength in psi (y) of paper as a
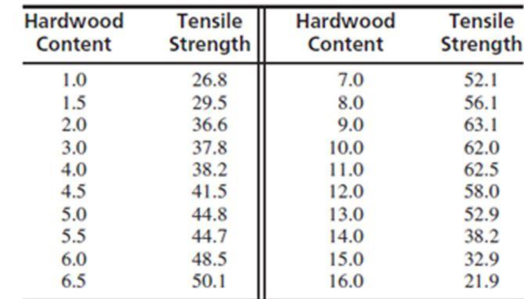
- a. Fit polynomial models of degrees 1, 2, and so on to predict tensile strength from hardwood content. For each one, use the F test to compare it with the model of degree one less. Stop when the P-value of the F test is greater than 0.05. What is the degree of the polynomial model chosen by this method?
- b.Using the model from part (a), estimate the hardwood concentration that produces the highest tensile strength.
Expert Solution & Answer
Want to see the full answer?
Check out a sample textbook solution
Chapter 8 Solutions
Connect Access Card for Statistics for Engineers and Scientists
Ch. 8.1 - In an experiment to determine the factors...Ch. 8.1 - Prob. 2ECh. 8.1 - Prob. 3ECh. 8.1 - The article Application of Analysis of Variance to...Ch. 8.1 - Prob. 5ECh. 8.1 - Prob. 6ECh. 8.1 - Prob. 7ECh. 8.1 - Refer to Exercise 7. a. Find a 95% confidence...Ch. 8.1 - In a study of the lung function of children, the...Ch. 8.1 - Prob. 10E
Ch. 8.1 - Prob. 11ECh. 8.1 - The following MINITAB output is for a multiple...Ch. 8.1 - Prob. 13ECh. 8.1 - Prob. 14ECh. 8.1 - Prob. 15ECh. 8.1 - The following data were collected in an experiment...Ch. 8.1 - The November 24, 2001, issue of The Economist...Ch. 8.1 - The article Multiple Linear Regression for Lake...Ch. 8.1 - Prob. 19ECh. 8.2 - In an experiment to determine factors related to...Ch. 8.2 - In a laboratory test of a new engine design, the...Ch. 8.2 - In a laboratory test of a new engine design, the...Ch. 8.2 - The article Influence of Freezing Temperature on...Ch. 8.2 - The article Influence of Freezing Temperature on...Ch. 8.2 - The article Influence of Freezing Temperature on...Ch. 8.3 - True or false: a. For any set of data, there is...Ch. 8.3 - The article Experimental Design Approach for the...Ch. 8.3 - Prob. 3ECh. 8.3 - An engineer measures a dependent variable y and...Ch. 8.3 - Prob. 5ECh. 8.3 - The following MINITAB output is for a best subsets...Ch. 8.3 - Prob. 7ECh. 8.3 - Prob. 8ECh. 8.3 - (Continues Exercise 7 in Section 8.1.) To try to...Ch. 8.3 - Prob. 10ECh. 8.3 - Prob. 11ECh. 8.3 - Prob. 12ECh. 8.3 - The article Ultimate Load Analysis of Plate...Ch. 8.3 - Prob. 14ECh. 8.3 - Prob. 15ECh. 8.3 - Prob. 16ECh. 8.3 - The article Modeling Resilient Modulus and...Ch. 8.3 - The article Models for Assessing Hoisting Times of...Ch. 8 - The article Advances in Oxygen Equivalence...Ch. 8 - Prob. 2SECh. 8 - Prob. 3SECh. 8 - Prob. 4SECh. 8 - In a simulation of 30 mobile computer networks,...Ch. 8 - The data in Table SE6 (page 649) consist of yield...Ch. 8 - Prob. 7SECh. 8 - Prob. 8SECh. 8 - Refer to Exercise 2 in Section 8.2. a. Using each...Ch. 8 - Prob. 10SECh. 8 - The data presented in the following table give the...Ch. 8 - The article Enthalpies and Entropies of Transfer...Ch. 8 - Prob. 13SECh. 8 - Prob. 14SECh. 8 - The article Measurements of the Thermal...Ch. 8 - The article Electrical Impedance Variation with...Ch. 8 - The article Groundwater Electromagnetic Imaging in...Ch. 8 - Prob. 18SECh. 8 - Prob. 19SECh. 8 - Prob. 20SECh. 8 - Prob. 21SECh. 8 - Prob. 22SECh. 8 - The article Estimating Resource Requirements at...Ch. 8 - Prob. 24SE
Additional Math Textbook Solutions
Find more solutions based on key concepts
A Pew Research Center survey found a noticeable rise in smartphone ownership and internet usage in emerging and...
Business Statistics: A First Course (8th Edition)
(a) For each data set, find the mean, median, and mode. (b) Discuss anything about the data that affects the us...
APPLIED STAT.IN BUS.+ECONOMICS
A simple random sample of 200 third-graders in a large school district was chosen to participate in an after-sc...
Essential Statistics
Testing Hypotheses. In Exercises 13-24, assume that a simple random sample has been selected and test the given...
Elementary Statistics Using The Ti-83/84 Plus Calculator, Books A La Carte Edition (5th Edition)
A father rates his daughter as a 2 on a 7-point scale (from 1 to 7) of crankiness. In this example, (a) what is...
Statistics for Psychology
Teacher Salaries
The following data from several years ago represent salaries (in dollars) from a school distri...
Elementary Statistics: A Step By Step Approach
Knowledge Booster


Learn more about
Need a deep-dive on the concept behind this application? Look no further. Learn more about this topic, statistics and related others by exploring similar questions and additional content below.Similar questions
Recommended textbooks for you
 Algebra & Trigonometry with Analytic GeometryAlgebraISBN:9781133382119Author:SwokowskiPublisher:Cengage
 Elementary Linear Algebra (MindTap Course List)AlgebraISBN:9781305658004Author:Ron LarsonPublisher:Cengage Learning
 Algebra and Trigonometry (MindTap Course List)AlgebraISBN:9781305071742Author:James Stewart, Lothar Redlin, Saleem WatsonPublisher:Cengage Learning
 Trigonometry (MindTap Course List)TrigonometryISBN:9781337278461Author:Ron LarsonPublisher:Cengage Learning
Algebra & Trigonometry with Analytic Geometry
Algebra
ISBN:9781133382119
Author:Swokowski
Publisher:Cengage
Elementary Linear Algebra (MindTap Course List)
Algebra
ISBN:9781305658004
Author:Ron Larson
Publisher:Cengage Learning
Algebra and Trigonometry (MindTap Course List)
Algebra
ISBN:9781305071742
Author:James Stewart, Lothar Redlin, Saleem Watson
Publisher:Cengage Learning
Trigonometry (MindTap Course List)
Trigonometry
ISBN:9781337278461
Author:Ron Larson
Publisher:Cengage Learning
Learn Algebra 6 : Rate of Change; Author: Derek Banas;https://www.youtube.com/watch?v=Dw701mKcJ1k;License: Standard YouTube License, CC-BY