
Videos
The article “Electrical Impedance Variation with Water Saturation in Rock” (Q. Su, Q. Feng, and Z. Shang, Geophysics, 2000:68–75) reports measurements of permeabilities (in 10–3μm2 percent), porosities (in percent), and surface area per unit volume of pore space (in 104 cm–1) for several rock samples. The results are presented in the following table, denoting In Permeability by y. porosity by x1, and surface area per unit volume by x2.
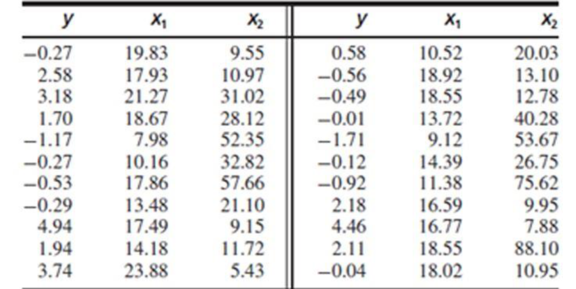
a. Fit the model
b. Fit the model
c. Fit the model
d. Compute the F statistics for comparing the models in parts (b) and (c) with the model in part (a). Which model do you prefer? Why?
Want to see the full answer?
Check out a sample textbook solution
Chapter 8 Solutions
Connect Access Card for Statistics for Engineers and Scientists
Additional Math Textbook Solutions
Elementary Statistics Using The Ti-83/84 Plus Calculator, Books A La Carte Edition (5th Edition)
Probability and Statistics for Engineering and the Sciences
Elementary Statistics Using the TI-83/84 Plus Calculator, Books a la Carte Edition (4th Edition)
APPLIED STAT.IN BUS.+ECONOMICS
Elementary Statistics Using Excel (6th Edition)
Research Methods for the Behavioral Sciences (MindTap Course List)


- The spike stature of the plants grown from the seeds of the porcine separates (Dactylis glomerata L) collected from the University campus and İbradı Eynif pasture are given below. In this plant, compare whether there is a difference between regions in terms of spike height. Virgo Height (cm) Data obtained from plants collected from university campus 5 6 8 7 8 6 5 5 4 6 6 Data obtained from plants collected from Eynif pasture 12 9 11 9 9 11 9 10 11 10 Note: Your results interpretation according to two different possibilities (Do it separately, assuming that it is 0.07 and 0.04).arrow_forwardAn article in the Journal of Applied Polymer Science (Vol. 56, pp. 471–476, 1995) studied the effect of the mole ratio of sebacic acid on the intrinsic viscosity of copolyesters.- The data follows: Viscosity 0.45 0.2 0.34 0.58 0.7 0.57 0.55 0.44 Mole ratio 1 0.9 0.8 0.7 0.6 0.5 0.4 0.3 (a) Construct a scatter diagram of the data.arrow_forwardThe article “Structural Performance of Rounded Dovetail Connections Under Different Loading Conditions” (T. Tannert, H. Prion, and F. Lam, Can J Civ Eng, 2007:1600–1605) describes a study of the deformation properties of dovetail joints. In one experiment, 10 rounded dovetail connections and 10 double rounded dovetail connections were loaded until failure. The rounded connections had an average load at failure of 8.27 kN with a standard deviation of 0.62 kN. The double-rounded connections had an average load at failure of 6.11 kN with a standard deviation of 1.31 kN. Can you conclude that the mean load at failure is greater for rounded connections than for double-rounded connections?arrow_forward
- The vapor pressure of 1-chlorotetradecane at several temperatures are tabulated below. T (ºC) P∗ mm Hg 98.5 1 131.8 5 148.2 10 166.2 20 199.8 60 215.5 100 What error is there in using two-point linear interpolation to find the value of vapor pressure at 185ºC?arrow_forwardIn a summary report given by Ing. Pobbi on the lengths of ironrods produced by two machines, he stated that the variability ofmachine A was higher compared to that of machine B. Critiquethe report of the Engineer given data on the length of rodsproduced given as; MachineA(cm): 380 410 280 310 305 360 270 355 400 Machine B(m): 1.1 1.3 1.2 2.0 1.5 1.6 1.4 1.6 1.7arrow_forwardA study of the properties of metal plate-connected trusses used for roof support yielded the following observations on axial stiffness index (kips/in.) for plate lengths 4, 6, 8, 10, and 12 in: 4: 323.2 409.5 311.0 326.5 316.8 349.8 309.7 6: 423.1 347.2 361.0 404.5 331.0 348.9 381.7 8: 393.4 366.2 351.0 357.1 409.9 367.3 382.0 10: 362.7 452.9 461.4 433.1 410.6 384.2 362.6 12: 418.4 441.8 419.9 410.7 473.4 441.2 465.8 Does variation in plate length have any effect on true average axial stiffness? State the relevant hypotheses using analysis of variance. H0: ?1 ≠ ?2 ≠ ?3 ≠ ?4 ≠ ?5Ha: at least two ?i's are equalH0: ?1 = ?2 = ?3 = ?4 = ?5Ha: all five ?i's are unequal H0: ?1 = ?2 = ?3 = ?4 = ?5Ha: at least two ?i's are unequalH0: ?1 ≠ ?2 ≠ ?3 ≠ ?4 ≠ ?5Ha: all five ?i's are equal Test the relevant hypotheses using analysis of variance with ? = 0.01. Display your results in an ANOVA table. (Round your answers to two decimal places.) Source Degrees offreedom Sum…arrow_forward
- A paper investigated the driving behavior of teenagers by observing their vehicles as they left a high school parking lot and then again at a site approximately 1 2 mile from the school. Assume that it is reasonable to regard the teen drivers in this study as representative of the population of teen drivers. Amount by Which Speed Limit Was Exceeded MaleDriver FemaleDriver 1.2 -0.1 1.4 0.4 0.9 1.1 2.1 0.7 0.7 1.1 1.3 1.2 3 0.1 1.3 0.9 0.6 0.5 2.1 0.5 (a) Use a .01 level of significance for any hypothesis tests. Data consistent with summary quantities appearing in the paper are given in the table. The measurements represent the difference between the observed vehicle speed and the posted speed limit (in miles per hour) for a sample of male teenage drivers and a sample of female teenage drivers. (Use μmales − μfemales.Round your test statistic to two decimal places. Round your degrees of freedom down to the nearest whole number. Round your p-value to…arrow_forwardA paper investigated the driving behavior of teenagers by observing their vehicles as they left a high school parking lot and then again at a site approximately 1 2 mile from the school. Assume that it is reasonable to regard the teen drivers in this study as representative of the population of teen drivers. Amount by Which Speed Limit Was Exceeded MaleDriver FemaleDriver 1.3 -0.1 1.3 0.4 0.9 1.1 2.1 0.7 0.7 1.1 1.3 1.2 3 0.1 1.3 0.9 0.6 0.5 2.1 0.5 (a) Use a .01 level of significance for any hypothesis tests. Data consistent with summary quantities appearing in the paper are given in the table. The measurements represent the difference between the observed vehicle speed and the posted speed limit (in miles per hour) for a sample of male teenage drivers and a sample of female teenage drivers. (Use μmales − μfemales.Round your test statistic to two decimal places. Round your degrees of freedom down to the nearest whole number. Round your p-value to…arrow_forwardWild irises are beautiful flowers found throughout the United States, Canada, and northern Europe. This problem concerns the length of the sepal (leaf-like part covering the flower) of different species of wild iris. Data are based on information taken from an article by R. A. Fisher in Annals of Eugenics (Vol. 7, part 2, pp. 179 -188). Measurements of sepal length in centimeters from random samples of Iris setosa (I), Iris versicolor (II), and Iris virginica (III) are as follows below. I II III 5.5 5.2 6.7 4.4 6.5 5.7 5.2 6.9 4.1 5.9 4.4 7.8 4.3 5.5 5.7 5.3 6.4 6.1 5.8 5.5 6.9 Shall we reject or not reject the claim that there are no differences among the population means of sepal length for the different species of iris? Use a 10% level of significance. (a) What is the level of significance? (b) Find SSTOT, SSBET, and SSW and check that SSTOT = SSBET + SSW. (Use 3 decimal places.) SSTOT = ? SSBET = ? SSW = ? Find d.f.BET, d.f.W, MSBET, and…arrow_forward
- Wild irises are beautiful flowers found throughout the United States, Canada, and northern Europe. This problem concerns the length of the sepal (leaf-like part covering the flower) of different species of wild iris. Data are based on information taken from an article by R. A. Fisher in Annals of Eugenics (Vol. 7, part 2, pp. 179 -188). Measurements of sepal length in centimeters from random samples of Iris setosa (I), Iris versicolor (II), and Iris virginica (III) are as follows below. I II III 5.5 5.2 6.8 4.6 6.5 5.3 5.1 6.1 4.4 5.5 4.1 7.9 4.1 5.1 5.9 5.4 6.1 6.9 5.4 5.1 6.6 Shall we reject or not reject the claim that there are no differences among the population means of sepal length for the different species of iris? Use a 5% level of significance. (a) What is the level of significance?State the null and alternate hypotheses. Ho: ?1 = ?2 = ?3; H1: Exactly two means are equal.Ho: ?1 = ?2 = ?3; H1: Not all the means are equal. Ho: ?1 = ?2 = ?3; H1:…arrow_forwardWild irises are beautiful flowers found throughout the United States, Canada, and northern Europe. This problem concerns the length of the sepal (leaf-like part covering the flower) of different species of wild iris. Data are based on information taken from an article by R. A. Fisher in Annals of Eugenics (Vol. 7, part 2, pp. 179 -188). Measurements of sepal length in centimeters from random samples of Iris setosa (I), Iris versicolor (II), and Iris virginica (III) are as follows below. I II III 5.7 5.4 6.8 4.1 6.3 5.4 5.0 6.7 4.4 5.4 4.3 7.3 4.6 5.5 5.3 5.7 6.5 6.7 5.2 5.3 6.8 Shall we reject or not reject the claim that there are no differences among the population means of sepal length for the different species of iris? Use a 5% level of significance. (a) What is the level of significance?State the null and alternate hypotheses. Ho: ?1 = ?2 = ?3; H1: All three means are different.Ho: ?1 = ?2 = ?3; H1: Not all the means are equal. Ho: ?1 = ?2 = ?3;…arrow_forwardWild irises are beautiful flowers found throughout the United States, Canada, and northern Europe. This problem concerns the length of the sepal (leaf-like part covering the flower) of different species of wild iris. Data are based on information taken from an article by R. A. Fisher in Annals of Eugenics (Vol. 7, part 2, pp. 179 -188). Measurements of sepal length in centimeters from random samples of Iris setosa (I), Iris versicolor (II), and Iris virginica (III) are as follows below. I II III 5.7 5.1 6.5 4.7 6.2 5.1 4.7 6.6 4.7 5.8 4.9 7.5 4.6 5.2 5.3 5.3 6.2 6.2 5.4 5.8 6.4 (b) Find SSTOT, SSBET, and SSW and check that SSTOT = SSBET + SSW. (Use 3 decimal places.) SSTOT = SSBET = SSW = Find d.f.BET, d.f.W, MSBET, and MSW. (Use 4 decimal places for MSBET, and MSW.) dfBET = dfW = MSBET = MSW = Find the value of the sample F statistic. (Use 2 decimal places.)What are the degrees of freedom? (numerator) (denominator)arrow_forward
 MATLAB: An Introduction with ApplicationsStatisticsISBN:9781119256830Author:Amos GilatPublisher:John Wiley & Sons Inc
 Probability and Statistics for Engineering and th...StatisticsISBN:9781305251809Author:Jay L. DevorePublisher:Cengage Learning
 Statistics for The Behavioral Sciences (MindTap C...StatisticsISBN:9781305504912Author:Frederick J Gravetter, Larry B. WallnauPublisher:Cengage Learning
 Elementary Statistics: Picturing the World (7th E...StatisticsISBN:9780134683416Author:Ron Larson, Betsy FarberPublisher:PEARSON
 The Basic Practice of StatisticsStatisticsISBN:9781319042578Author:David S. Moore, William I. Notz, Michael A. FlignerPublisher:W. H. Freeman
 Introduction to the Practice of StatisticsStatisticsISBN:9781319013387Author:David S. Moore, George P. McCabe, Bruce A. CraigPublisher:W. H. Freeman