
Videos
The November 24, 2001, issue of The Economist published economic data for 15 industrialized nations. Included were the percent changes in gross domestic product (GDP), industrial production (IP), consumer prices (CP), and producer prices (PP) from Fall 2000 to Fall 2001, and the unemployment rate in Fall 2001 (UNEMP). An economist wants to construct a model to predict GDP from the other variables. A fit of the model
yields the following output:
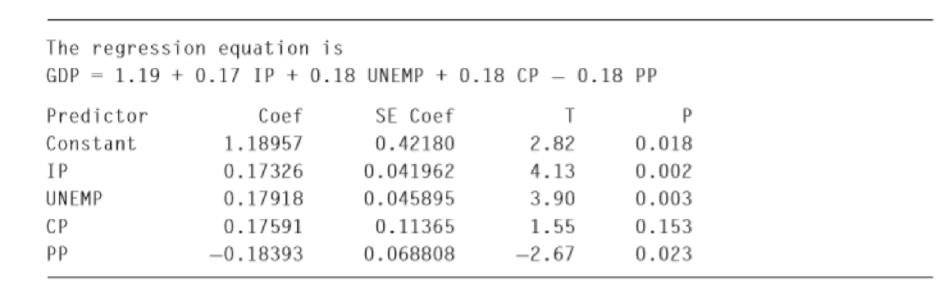
- a. Predict the percent change in GDP for a country with IP = 0.5, UNEMP = 5.7, CP = 3.0, and PP = 4.1.
- b. If two countries differ in unemployment rate by 1%, by how much would you predict their percent changes in GDP to differ, other things being equal?
- c. CP and PP are both measures of the inflation rate. Which one is more useful in predicting GDP? Explain.
- d. The producer price index for Sweden in September 2000 was 4.0, and for Austria it was 6.0. Other things being equal, for which country would you expect the percent change in GDP to be larger? Explain.

Trending nowThis is a popular solution!

Chapter 8 Solutions
Connect Access Card for Statistics for Engineers and Scientists
Additional Math Textbook Solutions
Essentials of Statistics, Books a la Carte Edition (5th Edition)
Elementary Statistics (13th Edition)
Statistics Through Applications
Statistics: The Art and Science of Learning from Data (4th Edition)
The Practice of Statistics for AP - 4th Edition
Introduction to Statistical Quality Control


- Olympic Pole Vault The graph in Figure 7 indicates that in recent years the winning Olympic men’s pole vault height has fallen below the value predicted by the regression line in Example 2. This might have occurred because when the pole vault was a new event there was much room for improvement in vaulters’ performances, whereas now even the best training can produce only incremental advances. Let’s see whether concentrating on more recent results gives a better predictor of future records. (a) Use the data in Table 2 (page 176) to complete the table of winning pole vault heights shown in the margin. (Note that we are using x=0 to correspond to the year 1972, where this restricted data set begins.) (b) Find the regression line for the data in part ‚(a). (c) Plot the data and the regression line on the same axes. Does the regression line seem to provide a good model for the data? (d) What does the regression line predict as the winning pole vault height for the 2012 Olympics? Compare this predicted value to the actual 2012 winning height of 5.97 m, as described on page 177. Has this new regression line provided a better prediction than the line in Example 2?arrow_forwardUrban Travel Times Population of cities and driving times are related, as shown in the accompanying table, which shows the 1960 population N, in thousands, for several cities, together with the average time T, in minutes, sent by residents driving to work. City Population N Driving time T Los Angeles 6489 16.8 Pittsburgh 1804 12.6 Washington 1808 14.3 Hutchinson 38 6.1 Nashville 347 10.8 Tallahassee 48 7.3 An analysis of these data, along with data from 17 other cities in the United States and Canada, led to a power model of average driving time as a function of population. a Construct a power model of driving time in minutes as a function of population measured in thousands b Is average driving time in Pittsburgh more or less than would be expected from its population? c If you wish to move to a smaller city to reduce your average driving time to work by 25, how much smaller should the city be?arrow_forward
 Linear Algebra: A Modern IntroductionAlgebraISBN:9781285463247Author:David PoolePublisher:Cengage Learning
 Functions and Change: A Modeling Approach to Coll...AlgebraISBN:9781337111348Author:Bruce Crauder, Benny Evans, Alan NoellPublisher:Cengage Learning
 College AlgebraAlgebraISBN:9781305115545Author:James Stewart, Lothar Redlin, Saleem WatsonPublisher:Cengage Learning
 Glencoe Algebra 1, Student Edition, 9780079039897...AlgebraISBN:9780079039897Author:CarterPublisher:McGraw Hill
 Big Ideas Math A Bridge To Success Algebra 1: Stu...AlgebraISBN:9781680331141Author:HOUGHTON MIFFLIN HARCOURTPublisher:Houghton Mifflin Harcourt