
Connect Access Card for Statistics for Engineers and Scientists
4th Edition
ISBN: 9780073518237
Author: William Navidi
Publisher: McGraw-Hill Education
expand_more
expand_more
format_list_bulleted
Videos
Textbook Question
Chapter 8.2, Problem 6E
The article “Influence of Freezing Temperature on Hydraulic Conductivity of Silty Clay” (J. Konrad and M. Samson, Journal of Geotechnical and Geoenvironmental Engineering, 2000:180–187) describes a study of factors affecting hydraulic conductivity of soils. The measurements of hydraulic conductivity in units of 10–8 cm/s (y), initial void ratio (x1). and thawed void ratio (x2) for 12 specimens of silty clay are presented in the following table.
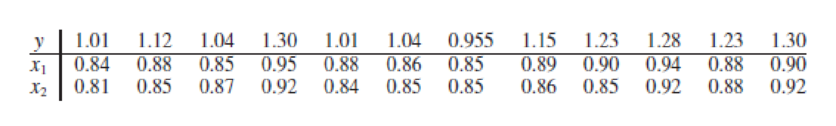
- a. Fit the model y = β0 + β1x1 + ε. For each coefficient, test the null hypothesis that it is equal to 0.
- b. Fit the model y = β0 + β1x2 + ε. For each coefficient, test the null hypothesis that it is equal to 0.
- c. Fit the model y = β0 + β1x1 + β2x2 + ε. For each coefficient, test the null hypothesis that it is equal to 0.
- d. Which of the models in parts (a) to (c) is the best of the three? Why do you think so?
Expert Solution & Answer
Want to see the full answer?
Check out a sample textbook solution
Students have asked these similar questions
An article in the Journal of Applied Polymer Science (Vol. 56, pp. 471–476, 1995) studied the effect of the mole ratio of sebacic acid on the intrinsic viscosity of copolyesters.- The data follows: Viscosity 0.45 0.2 0.34 0.58 0.7 0.57 0.55 0.44 Mole ratio 1 0.9 0.8 0.7 0.6 0.5 0.4 0.3 (a) Construct a scatter diagram of the data.
The efficiency ratio for a steel specimen immersed in a phosphating tank is the weight of the phosphate coating divided by the metal loss (both in mg/ft2). The article “Statistical Process Control of a Phosphate Coating Line” (Wire J. Intl., May 1997: 78–81) gave the accompanying data on tank temperature (x) and efficiency ratio (y).Temp. 170 172 173 174 174 175 176Ratio .84 1.31 1.42 1.03 1.07 1.08 1.04Temp. 177 180 180 180 180 180 181Ratio 1.80 1.45 1.60 1.61 2.13 2.15 .84Temp. 181 182 182 182 182 184 184Ratio 1.43 .90 1.81 1.94 2.68 1.49 2.52Temp. 185 186 188Ratio 3.00 1.87 3.08a. Construct stem-and-leaf displays of both temperature and efficiency ratio, and comment on interesting features.b. Is the value of efficiency ratio completely and uniquely determined by tank temperature? Explain your reasoning.c. Construct a scatterplot of the data. Does it appear that efficiency ratio could be very well predicted by the value of temperature? Explain your reasoning.
An article in the ASCE Journal of Energy Engineering [“Overview of Reservoir Release Improvements at 20 TVA Dams” (Vol. 125, April 1999, pp. 1–17)] presents data on dissolved oxygen concentrations in streams below 20 dams in the Tennessee Valley Authority system. The observations are (in milligrams per liter):
Chapter 8 Solutions
Connect Access Card for Statistics for Engineers and Scientists
Ch. 8.1 - In an experiment to determine the factors...Ch. 8.1 - Prob. 2ECh. 8.1 - Prob. 3ECh. 8.1 - The article Application of Analysis of Variance to...Ch. 8.1 - Prob. 5ECh. 8.1 - Prob. 6ECh. 8.1 - Prob. 7ECh. 8.1 - Refer to Exercise 7. a. Find a 95% confidence...Ch. 8.1 - In a study of the lung function of children, the...Ch. 8.1 - Prob. 10E
Ch. 8.1 - Prob. 11ECh. 8.1 - The following MINITAB output is for a multiple...Ch. 8.1 - Prob. 13ECh. 8.1 - Prob. 14ECh. 8.1 - Prob. 15ECh. 8.1 - The following data were collected in an experiment...Ch. 8.1 - The November 24, 2001, issue of The Economist...Ch. 8.1 - The article Multiple Linear Regression for Lake...Ch. 8.1 - Prob. 19ECh. 8.2 - In an experiment to determine factors related to...Ch. 8.2 - In a laboratory test of a new engine design, the...Ch. 8.2 - In a laboratory test of a new engine design, the...Ch. 8.2 - The article Influence of Freezing Temperature on...Ch. 8.2 - The article Influence of Freezing Temperature on...Ch. 8.2 - The article Influence of Freezing Temperature on...Ch. 8.3 - True or false: a. For any set of data, there is...Ch. 8.3 - The article Experimental Design Approach for the...Ch. 8.3 - Prob. 3ECh. 8.3 - An engineer measures a dependent variable y and...Ch. 8.3 - Prob. 5ECh. 8.3 - The following MINITAB output is for a best subsets...Ch. 8.3 - Prob. 7ECh. 8.3 - Prob. 8ECh. 8.3 - (Continues Exercise 7 in Section 8.1.) To try to...Ch. 8.3 - Prob. 10ECh. 8.3 - Prob. 11ECh. 8.3 - Prob. 12ECh. 8.3 - The article Ultimate Load Analysis of Plate...Ch. 8.3 - Prob. 14ECh. 8.3 - Prob. 15ECh. 8.3 - Prob. 16ECh. 8.3 - The article Modeling Resilient Modulus and...Ch. 8.3 - The article Models for Assessing Hoisting Times of...Ch. 8 - The article Advances in Oxygen Equivalence...Ch. 8 - Prob. 2SECh. 8 - Prob. 3SECh. 8 - Prob. 4SECh. 8 - In a simulation of 30 mobile computer networks,...Ch. 8 - The data in Table SE6 (page 649) consist of yield...Ch. 8 - Prob. 7SECh. 8 - Prob. 8SECh. 8 - Refer to Exercise 2 in Section 8.2. a. Using each...Ch. 8 - Prob. 10SECh. 8 - The data presented in the following table give the...Ch. 8 - The article Enthalpies and Entropies of Transfer...Ch. 8 - Prob. 13SECh. 8 - Prob. 14SECh. 8 - The article Measurements of the Thermal...Ch. 8 - The article Electrical Impedance Variation with...Ch. 8 - The article Groundwater Electromagnetic Imaging in...Ch. 8 - Prob. 18SECh. 8 - Prob. 19SECh. 8 - Prob. 20SECh. 8 - Prob. 21SECh. 8 - Prob. 22SECh. 8 - The article Estimating Resource Requirements at...Ch. 8 - Prob. 24SE
Additional Math Textbook Solutions
Find more solutions based on key concepts
Four different beverages are sold at a fast-food restaurant: soft drinks, tea, coffee, and bottled water. a. Ex...
Basic Business Statistics, Student Value Edition
A simple random sample of 200 third-graders in a large school district was chosen to participate in an after-sc...
Essential Statistics
AVX Home Entertainment, Inc., recently began a “no-hassles” return policy. A sample of 500 customers who recent...
EBK STATISTICAL TECHNIQUES IN BUSINESS
In Exercises 5-36, express all probabilities as fractions.
23. Combination Lock The typical combination lock us...
Essentials of Statistics, Books a la Carte Edition (5th Edition)
Use the following information to answer the next 14 exercises: The mean age for all Foothill College students f...
Introductory Statistics
In Exercises 9-20, use the data in the following table, which lists drive-thru order accuracy at popular fast f...
Essentials of Statistics (6th Edition)
Knowledge Booster


Learn more about
Need a deep-dive on the concept behind this application? Look no further. Learn more about this topic, statistics and related others by exploring similar questions and additional content below.Similar questions
- In the article “Groundwater Electromagnetic Imaging in Complex Geological and Topographical Regions: A Case Study of a Tectonic Boundary in the French Alps” (S. Houtot, P. Tarits, et al., Geophysics, 2002:1048–1060), the pH was measured for several water samples in various locations near Gittaz Lake in the French Alps. The results for 11 locations on the northern side of the lake and for 6 locations on the southern side are as follows: Northern side: 8.1 8.2 8.1 8.2 8.2 7.4 7.3 7.4 8.1 8.1 7.9 Southern side: 7.8 8.2 7.9 7.9 8.1 8.1 Find a 98% confidence interval for the difference in pH between the northern and southern side.arrow_forwardAn article in Technometrics (1974, Vol. 16, pp. 523–531) considered the following stack-loss data from a plant oxidizing ammonia to nitric acid. Twenty-one daily responses of stack loss (the amount of ammonia escaping) were measured with air flow x1, temperature x2, and acid concentration x3. y = 42, 37, 37, 28, 18, 18, 19, 20, 15, 14, 14, 13, 11, 12, 8, 7, 8, 8, 9, 15, 15 x1 = 80, 80, 75, 62, 62, 62, 62, 62, 58, 58, 58, 58, 58, 58, 50, 50, 50, 50, 50, 56, 70 x2 = 27, 27, 25, 24, 22, 23, 24, 24, 23, 18, 18, 17, 18, 19, 18, 18, 19, 19, 20, 20, 20 x3 = 89, 88, 90, 87, 87, 87, 93, 93, 87, 80, 89, 88, 82, 93, 89, 86, 72, 79, 80, 82, 91 (a) Fit a linear regression model relating the results of the stack loss to the three regressor variables. (b) Estimate σ2. (c) Find the standard error se(βj). (d) Use the model in part (a) to predict stack loss when x1 = 60, x2 = 26, and x3 = 85.arrow_forwardSuppose that samples of polythene bags from two manufacturers A and B are tested by a prospective buyer for bursting pressure, with the following results: If the prices are the same, which manufacture’s bags would be preferred by the buyer? Why?arrow_forward
- What is the difference between the critical value of z and the observed value of z?arrow_forwardThe article “Effect of Varying Solids Concentration and Organic Loading on the Performance of Temperature Phased Anaerobic Digestion Process” (S. Vandenburgh and T. Ellis, Water Environment Research, 2002:142–148) discusses experiments to determine the effect of the solids concentration on the performance of treatment methods for wastewater sludge. In the first experiment, the concentration of solids (in g/L) was 43.94 ± 1.18. In the second experiment, which was independent of the first, the concentration was 48.66 ± 1.76. Estimate the difference in the concentration between the two experiments, and find the uncertainty in the estimate.arrow_forwardONLY THE LAST ONE Consider the accompanying data on flexural strength (MPa) for concrete beams of a certain type. 5.9 7.2 7.3 6.3 8.1 6.8 7.0 7.5 6.8 6.5 7.0 6.3 7.9 9.0 8.4 8.7 7.8 9.7 7.4 7.7 9.7 8.2 7.7 11.6 11.3 11.8 10.7 The data below give accompanying strength observations for cylinders. 6.5 5.8 7.8 7.1 7.2 9.2 6.6 8.3 7.0 8.3 7.8 8.1 7.4 8.5 8.9 9.8 9.7 14.1 12.6 11.9 Prior to obtaining data, denote the beam strengths by X1, . . . , Xm and the cylinder strengths by Y1, . . . , Yn. Suppose that the Xi's constitute a random sample from a distribution with mean μ1 and standard deviation σ1 and that the Yi's form a random sample (independent of the Xi's) from another distribution with mean μ2 and standard deviation σ2. (a) Use rules of expected value to show that X − Y is an unbiased estimator of μ1 − μ2. E(X − Y) = E(X) − E(Y) = μ1 − μ2 E(X − Y) = E(X) − E(Y) 2 = μ1 − μ2 E(X − Y) = nm E(X) − E(Y) = μ1 − μ2 E(X −…arrow_forward
- The sulfate ion concentration in natural water can be determined by measuring the turbidity that results when an excess of BaCl2 is added to a measured quantity of the sample. A turbiditimeter, the instrument used for this analysis, was calibrated with a series of standard Na2SO4 solutions. The following data were obtained for the calibration:arrow_forwardFind kurtosis using quartile deviation.arrow_forwardPoly(3-hydroxybutyrate) (PHB), a semicrystalline polymer that is fully biodegradable and biocompatible, is obtained from renewable resources. From a sustainability perspective, PHB offers many attractive properties though it is more expensive to produce than standard plastics. The accompanying data on melting point (°C) for each of 12 specimens of the polymer using a differential scanning calorimeter appeared in an article. 180.4 181.7 180.9 181.7 182.7 181.5 181.4 182.1 182.1 180.4 181.8 180.4 Compute the following. (Round your answer to two decimal places.) b. the sample variance s2 from the definition [Hint: First subtract 180 from each observation.] c. the sample standard deviation d. s2 using the shortcut methodarrow_forward
- A statistical program is recommended. Electromagnetic technologies offer effective nondestructive sensing techniques for determining characteristics of pavement. The propagation of electromagnetic waves through the material depends on its dielectric properties. The following data, kindly provided by the authors of the article "Dielectric Modeling of Asphalt Mixtures and Relationship with Density,"† was used to relate y = dielectric constant to x = air void (%) for 18 samples having 5% asphalt content. y 4.55 4.49 4.50 4.47 4.47 4.45 4.40 4.34 4.43 4.43 4.42 4.40 4.33 4.44 4.40 4.26 4.32 4.34 x 4.35 4.79 5.57 5.20 5.07 5.79 5.36 6.40 5.66 5.90 6.49 5.70 6.49 6.37 6.51 7.88 6.74 7.08 The following R output is from a simple linear regression of y on x. Estimate Std. Error t value Pr(>|t|) (Intercept) 4.858691 0.059768 81.283 <2e-16 AirVoid −0.074676 0.009923 −7.526 1.21e-06 Residual standard error: 0.03551 on 16 DF Multiple R-squared: 0.7797, Adjusted…arrow_forwardA fast-food chain decided to carry out an experiment to assess the influence of advertising expenditure on sales. Different relative changes in advertising expenditure, compared to the previous year, were made in eight regions of the country, and resulting changes in sales levels were observed the accompanying table shows the results. Increase in advertising expenditure (%) 0 5 15 20 25 30 35 40 Increase in sales (%) 5 10 18 25 35 50 60 65 Determine the value of ∑X, ∑X2, ∑Y, ∑Y2, ∑XY. Where X represent independent variable and Y for dependent variable. Determine and interpret the coefficient of correlation between the two variables. Determine the value of regressions coefficients and write down the simple linear regression model.…arrow_forwardA fast-food chain decided to carry out an experiment to assess the influence of advertising expenditure on sales. Different relative changes in advertising expenditure, compared to the previous year, were made in eight regions of the country, and resulting changes in sales levels were observed the accompanying table shows the results. Increase in advertising expenditure (%) 0 5 15 20 25 30 35 40 Increase in sales (%) 5 10 18 25 35 50 60 65 Determine the value of ∑X, ∑X2, ∑Y, ∑Y2, ∑XY. Where X represent independent variable and Y for dependent variable. Determine and interpret the coefficient of correlation between the two variables. Determine the value of regressions coefficients and write down the simple linear regression model. Test the validity of the model…arrow_forward
arrow_back_ios
SEE MORE QUESTIONS
arrow_forward_ios
Recommended textbooks for you
 MATLAB: An Introduction with ApplicationsStatisticsISBN:9781119256830Author:Amos GilatPublisher:John Wiley & Sons Inc
 Probability and Statistics for Engineering and th...StatisticsISBN:9781305251809Author:Jay L. DevorePublisher:Cengage Learning
 Statistics for The Behavioral Sciences (MindTap C...StatisticsISBN:9781305504912Author:Frederick J Gravetter, Larry B. WallnauPublisher:Cengage Learning
 Elementary Statistics: Picturing the World (7th E...StatisticsISBN:9780134683416Author:Ron Larson, Betsy FarberPublisher:PEARSON
 The Basic Practice of StatisticsStatisticsISBN:9781319042578Author:David S. Moore, William I. Notz, Michael A. FlignerPublisher:W. H. Freeman
 Introduction to the Practice of StatisticsStatisticsISBN:9781319013387Author:David S. Moore, George P. McCabe, Bruce A. CraigPublisher:W. H. Freeman
MATLAB: An Introduction with Applications
Statistics
ISBN:9781119256830
Author:Amos Gilat
Publisher:John Wiley & Sons Inc
Probability and Statistics for Engineering and th...
Statistics
ISBN:9781305251809
Author:Jay L. Devore
Publisher:Cengage Learning
Statistics for The Behavioral Sciences (MindTap C...
Statistics
ISBN:9781305504912
Author:Frederick J Gravetter, Larry B. Wallnau
Publisher:Cengage Learning
Elementary Statistics: Picturing the World (7th E...
Statistics
ISBN:9780134683416
Author:Ron Larson, Betsy Farber
Publisher:PEARSON
The Basic Practice of Statistics
Statistics
ISBN:9781319042578
Author:David S. Moore, William I. Notz, Michael A. Fligner
Publisher:W. H. Freeman
Introduction to the Practice of Statistics
Statistics
ISBN:9781319013387
Author:David S. Moore, George P. McCabe, Bruce A. Craig
Publisher:W. H. Freeman
Hypothesis Testing using Confidence Interval Approach; Author: BUM2413 Applied Statistics UMP;https://www.youtube.com/watch?v=Hq1l3e9pLyY;License: Standard YouTube License, CC-BY
Hypothesis Testing - Difference of Two Means - Student's -Distribution & Normal Distribution; Author: The Organic Chemistry Tutor;https://www.youtube.com/watch?v=UcZwyzwWU7o;License: Standard Youtube License