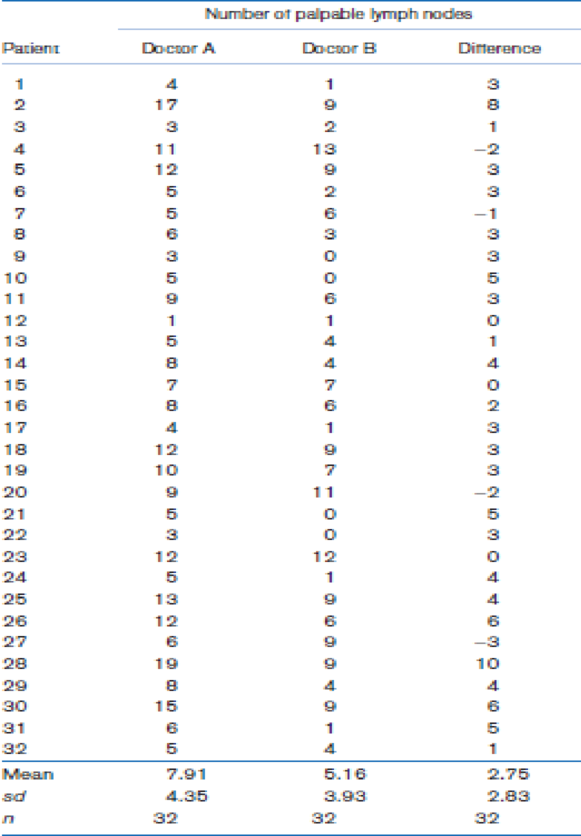
The degree of clinical agreement among physicians on the presence or absence of generalized lymphadenopathy was assessed in 32 randomly selected participants from a prospective study of male sexual contacts of men with acquired immunodeficiency syndrome (AIDS) or an AIDS-related condition (ARC) [8]. The total number of palpable lymph nodes was assessed by each of three physicians. Results from two of the three physicians are presented in Table 8.15. What is the appropriate test procedure to determine whether there is a systematic difference between the assessments of Doctor A vs. Doctor B? Table 8.15 Reproducibility of assessment of number of palpable lymph nodes among sexual contacts of AIDS or ARC patients
The degree of clinical agreement among physicians on the presence or absence of generalized lymphadenopathy was assessed in 32 randomly selected participants from a prospective study of male sexual contacts of men with acquired immunodeficiency syndrome (AIDS) or an AIDS-related condition (ARC) [8]. The total number of palpable lymph nodes was assessed by each of three physicians. Results from two of the three physicians are presented in Table 8.15. What is the appropriate test procedure to determine whether there is a systematic difference between the assessments of Doctor A vs. Doctor B? Table 8.15 Reproducibility of assessment of number of palpable lymph nodes among sexual contacts of AIDS or ARC patients
Solution Summary: The author explains that the appropriate procedure to test for a significant difference in means between the assessments of two doctors is paired t test.
The degree of clinical agreement among physicians on the presence or absence of generalized lymphadenopathy was assessed in 32 randomly selected participants from a prospective study of male sexual contacts of men with acquired immunodeficiency syndrome (AIDS) or an AIDS-related condition (ARC) [8]. The total number of palpable lymph nodes was assessed by each of three physicians. Results from two of the three physicians are presented in Table 8.15.
What is the appropriate test procedure to determine whether there is a systematic difference between the assessments of Doctor A vs. Doctor B?
Table 8.15 Reproducibility of assessment of number of palpable lymph nodes among sexual contacts of AIDS or ARC patients
The article "Analysis of Unwanted Fire Alarm: Case Study" (W. Chow, N. Fong, and C.
Ho, Journal of Architectural Engineering, 1999:62–65) presents a count of the number of
false alarms at several sites. The numbers of false alarms each month, divided into those
with known causes and those with unknown causes, are given in the following table. Can
you conclude that the proportion of false alarms whose cause is known differs from month
to month?
Month
1 2 3
7 8 9 10 11 12
4 5
6
20 13 21 26 23 18 14 10 20 20 18 14
Unknown 12 2 16 12 22 30 32 32 14 16 10 12
Known
The degree of clinical agreement among physicians on the presence or absence of generalized lymphadenopathy was assessed in 32 randomly selected participants from a prospective study of male sexual contacts of men with acquired immunodeficiency syndrome (AIDS) or an AIDS-related condition (ARC). The total number of palpable lymph nodes was assessed by each of three physicians. Results from two of the three physicians are presented in the table attached. Determine whether there is a systematic difference between the assessments of Doctor A vs. Doctor B using 1% level of significance.
1. What is the appropriate test that should be conducted to determine significance of difference?
2.Determine the correct hypotheses?
3.What is the computed test statistic?
4.What decision can be made if the alpha and the p-value are compared?
5. What conclusion may be formed based on the decision above?
The article "Vehicle-Arrival Characteristics at Urban Uncontrolled Intersections" (V.
Rengaraju and V. Rao, Journal of Transportation Engineering, 1995: 317-323) presents
data on traffic characteristics at 10 intersections in Madras, India. One characteristic
measured was the speeds of the vehicles traveling through the intersections. The
accompanying table gives the 15th, 50th, and 85th percentiles of speed (in km/h) for two
intersections.
Percentile
Intersection
15th
50th
85th
27.5
37.5
40.0
в
24.5
26.5
36.0
If a histogram for speeds of vehicles through intersection A were drawn, would it most
likely be skewed to the left, skewed to the right, or approximately symmetric? Explain.
b. If a histogram for speeds of vehicles through intersection B were drawn, would it most
likely be skewed to the left, skewed to the right, or approximately symmetric? Explain.
a.
Chapter 8 Solutions
WebAssign for Rosner's Fundamentals of Biostatistics, 8th Edition [Instant Access], Single-Term
Need a deep-dive on the concept behind this application? Look no further. Learn more about this topic, statistics and related others by exploring similar questions and additional content below.
Hypothesis Testing using Confidence Interval Approach; Author: BUM2413 Applied Statistics UMP;https://www.youtube.com/watch?v=Hq1l3e9pLyY;License: Standard YouTube License, CC-BY
Hypothesis Testing - Difference of Two Means - Student's -Distribution & Normal Distribution; Author: The Organic Chemistry Tutor;https://www.youtube.com/watch?v=UcZwyzwWU7o;License: Standard Youtube License
![WebAssign for Rosner's Fundamentals of Biostatistics, 8th Edition [Instant Access], Single-Term](https://s3.amazonaws.com/compass-isbn-assets/textbook_empty_images/large_textbook_empty.svg)


 Glencoe Algebra 1, Student Edition, 9780079039897...AlgebraISBN:9780079039897Author:CarterPublisher:McGraw Hill
 Calculus For The Life SciencesCalculusISBN:9780321964038Author:GREENWELL, Raymond N., RITCHEY, Nathan P., Lial, Margaret L.Publisher:Pearson Addison Wesley,
 College Algebra (MindTap Course List)AlgebraISBN:9781305652231Author:R. David Gustafson, Jeff HughesPublisher:Cengage Learning
 Big Ideas Math A Bridge To Success Algebra 1: Stu...AlgebraISBN:9781680331141Author:HOUGHTON MIFFLIN HARCOURTPublisher:Houghton Mifflin Harcourt