![WebAssign for Rosner's Fundamentals of Biostatistics, 8th Edition [Instant Access], Single-Term](https://s3.amazonaws.com/compass-isbn-assets/textbook_empty_images/large_textbook_empty.svg)
Videos
study was recently reported comparing the effects of different dietary patterns on blood pressure within an 8-week follow-up period [16]. Subjects were randomized to three groups: A, a control diet group, N = 154; B, a fruits-andvegetables diet group, N = 154; C, a combination-diet group consisting of a diet rich in fruits, vegetables, and lowfat dairy products and with reduced saturated and total fat, N = 151. The results reported for systolic blood pressure (SBP) are shown in Table 8.29.
Table 8.29 Effects of dietary pattern on change in SBP
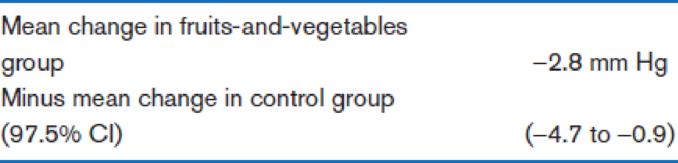
Suppose we assume that the standard deviation of change in blood pressure is the same in each group and is known without error. Compute the exact p-value from the information provided.
Want to see the full answer?
Check out a sample textbook solution
Chapter 8 Solutions
WebAssign for Rosner's Fundamentals of Biostatistics, 8th Edition [Instant Access], Single-Term


- A case−control study was performed among 145 subjects with macular degeneration and 34 controls, all of whom were 70- to 79-year-old women. A genetic risk score was developed to help differentiate the cases from the controls. The risk score was categorized into six groups (1, 2, 3, 4, 5, 6), with 6 being the highest risk and 1 being the lowest risk.The data in Table 10.48 were obtained relating the risk score to case/control status. taBlE 10.48 risk score cases controls 1 3 11 2 7 3 3 6 6 4 10 8 5 11 2 6 108 4 total 145 34 10.139 What test can be performed to study the asso- ciation between case/control status and risk score? Spe- cifically, we are interested in testing whether cases tend to have consistently higher risk scores or consistently lower risk scores than controls.arrow_forwardA pathological video game user (PVGU) is a video game user that averages 31 or more hours a week of gameplay. According to the article “Pathological Video Game Use among Youths: A Two-Year Longitudinal Study” (Pediatrics, Vol. 127, No. 2, pp. 319–329) by D. Gentile et al., in 2011, about 9% of children in grades 3–8 were PVGUs. Suppose that, today, five youths in grades 3–8 are randomly selected. Let X represent the number of youths who are PVGUs. n = p = 1 – p = Prepare the probability distribution for the random variable X. Complete the following table. Round your answers to 4 decimal places e.g. 0.XXXX or .XXXX. X = x P(X=x) 0 1 2 3 4 5 ∑=1.0000∑=1.0000 Calculate the probability that EXACTLY three youths are PVGUs. Round your answers to 4 decimal places e.g. 0.XXXX or .XXXX. P(X = 3) = Calculate the probability that AT LEAST two youths are PVGUs. Round your answers to 4 decimal places e.g. 0.XXXX or .XXXX. P(X ≥ 2) = Calculate the…arrow_forwardA pathological video game user (PVGU) is a video game user that averages 31 or more hours a week of gameplay. According to the article “Pathological Video Game Use among Youths: A Two-Year Longitudinal Study” (Pediatrics, Vol. 127, No. 2, pp. 319–329) by D. Gentile et al., in 2011, about 9% of children in grades 3–8 were PVGUs. Suppose that, today, five youths in grades 3–8 are randomly selected. Let X represent the number of youths who are PVGUs. Calculate the probability that EXACTLY three youths are PVGUsarrow_forward
- The Paleo diet allows only for foods that humans typically consumed over the last 2.5 million years, excluding those agriculture-type foods that arose during the last 10,000 years or so. Researchers randomly divided 500 volunteers into two equal-sized groups. One group spent 6 months on the Paleo diet. The other group received a pamphlet about controlling portion sizes. Randomized treatment assignment was performed, and at the beginning of the study, the average difference in weights between the two groups was about 0 pounds. After the study, the Paleo group had lost an average of 7.6 pounds with a standard deviation of 20.75 pounds while the control group had lost an average of 5.8 pounds with a standard deviation of 12.5 pounds. What is the P value?arrow_forwardA study was undertaken to investigate the effectiveness of an aquarobic exercise program for patients with osteoarthritis. A convenience sample of 70 individuals with arthritis was selected, and each person was randomly assigned to one of two groups. The first group participated in a weekly aquarobic exercise program for 8 weeks; the second group served as a control. Several pieces of data were collected from the individuals, including their total cholesterol (mg). Determine if there is a significant difference in the mean cholesterol for the two groups (aquarobic & control) at the start of the study using a significance level of 0.01. Difference Sample Diff. Std. Error df Aquarobic - Control -13.9045 6.8214 67.8635 What hypotheses should be tested? Make sure to select the hypotheses which are written with notation consistent with the type of samples selected. Ho:μd=0Ho:μd=0Ha:μd>0Ha:μd>0 Ho:μd=0Ho:μd=0Ha:μd<0Ha:μd<0 Ho:μ1=μ2Ho:μ1=μ2Ha:μ1<μ2Ha:μ1<μ2…arrow_forwardA study was undertaken to investigate the effectiveness of an aquarobic exercise program for patients with osteoarthritis. A convenience sample of 70 individuals with arthritis was selected, and each person was randomly assigned to one of two groups. The first group participated in a weekly aquarobic exercise program for 8 weeks; the second group served as a control. Several pieces of data were collected from the individuals, including their total cholesterol (mg). Determine if there is a significant difference in the mean cholesterol for the two groups (aquarobic & control) at the start of the study using a significance level of 0.10. Difference Sample Diff. Std. Error df Aquarobic - Control 2.698 7.3227 65.6844 • What hypotheses should be tested? Make sure to select the hypotheses which are written with notation consistent with the type of samples selected. H.: µd = l2 H.: µ1 = µ2 H.:µd H.: Hd > 0 Ha: H1 # H2 Ha:µ1 > µ2 Ha:Hd < 0 Ha:H1 < µs Ha: Hd # 0 = 0 H,:µ1 0 H.: µ1 = µ2 H.: µd •…arrow_forward
- A study was undertaken to investigate the effectiveness of an aquarobic exercise program for patients with osteoarthritis. A convenience sample of 70 individuals with arthritis was selected, and each person was randomly assigned to one of two groups. The first group participated in a weekly aquarobic exercise program for 8 weeks; the second group served as a control. Several pieces of data were collected from the individuals, including their total cholesterol (mg). Determine if there is a significant difference in the mean cholesterol for the two groups (aquarobic & control) at the start of the study using a significance level of 0.01. Difference Sample Diff. Std. Error df Aquarobic - Control 4.8006 8.4711 59.5847 What hypotheses should be tested? Make sure to select the hypotheses which are written with notation consistent with the type of samples selected. Ho:μ1=μ2Ho:μ1=μ2Ha:μ1>μ2Ha:μ1>μ2 Ho:μd=0Ho:μd=0Ha:μd>0Ha:μd>0 Ho:μd=0Ho:μd=0Ha:μd≠0Ha:μd≠0…arrow_forwardPassive exposure to environmental tobacco smoke has been associated with growth suppression and an increased frequency of respiratory tract infections in normal children. Is this association more pronounced in children with cystic fibrosis? To answer this question, 43 children (18 girls and 25 boys) attending a 2-week summer camp for cystic fibrosis patients were studied (New England Journal of Medicine, Sept. 20, 1990). Among several variables measured were the child's weight percentile (y) and the number of cigarettes smoked per day in the child's home (x). a. For the 18 girls, the coefficient of correlation between y and x was reported as r = –.50. Interpret - this result. b. Refer to part a. The p-value for testing Ho: p = 0 against H;: p # 0 was reported as p = .03. n Interpret this result. c. For the 25 boys, the coefficient of correlation between y and x was reported asr = -.12. Interpret %3D %3D this result. d. Refer to part c. The p-value for testing Ho: p = 0 against Ha: p #…arrow_forwardA study was made of 1,057 cases of poisoning in children treated as inpatients at Milwaukee Children's Hospital from 1962 through 1968. Data on date of occurrence, age and sex of the child, and type of agent involved were recorded and analyzed by standard statistical methods. Poisoning was due to ingestion of aspirin in 35 per cent of the children studied and to the ingestion of hydrocarbon distillates in 18 per cent. A statistically significant male dominance was found for ingestion of hydrocarbons; age-specific peaks were found for some categories. Trends as to the relative and absolute frequencies of each specific poison from one year to the next were noted; possible reasons for increasing or decreasing trends are discussed. Is this study descriptive or inferential? Explain your answer. What are the variables used in the study? In your opinion, what level of measurement was used to obtain the data from the variables? Does the article define the population? If so, how is it…arrow_forward
- An experiment was conducted for better understanding of the effectiveness of a particular type of drug for reducing bad cholesterol (LDL) level. The purpose of the experiment was to determine whether different dosages used have significant different outcomes in average LDL reduction. Twenty subjects with LDL at around 250 to 300 mg/dL had participated in the study and were randomly divided into four groups. Each group was given a specific level of dosage of the drug each day for one month, with a control group that only provided with placebo. The reduction in LDL was recorded and showed in the following table. Positive number indicates reduction and negative numbers indicates increasing in DLD. Use statistical software to analyze the data and answer the following question. Control Light Dosage Level Medium Dosage Level Heavy Dosage Level 7 25 73 81 -3 17 60 71 6 22 55 79 5 21 41 60 15 12 36 85 Perform a One-way…arrow_forwardAs men age, their testosterone levels gradually decrease. This may cause a reduction in energy, an increase in fat, and other undesirable changes. Do testosterone supplements reverse some of these effects? A study in the Netherlands assigned 237 men aged 60 to 80 with low or low-normal testosterone levels to either a testosterone supplement or a placebo. Why is it necessary to include a control group in this experiment? Every experiment needs a control group in order to make proper comparisons between treatments. A control group is necessary to balance the effects of other variables among the treatment groups. A control group is necessary so any differences in the effects of the treatments can be distinguished from chance differences between the groups. A control group helps avoid confounding and reduces variability in the response variable. A control group is used to provide a baseline for comparing the effects of other treatments.arrow_forwardCalcium and Blood Pressure Does increasing the amount of calcium in our diet reduce blood pressure? Examination of a large sample of people revealed a relationship between calcium intake and blood pressure. Such observational studies do not establish causation. Researchers therefore designed a randomized comparative experiment. The subjects were 21 healthy men who volunteered to take part in the experiment. They were randomly assigned to two groups: 10 of the men received a calcium supplement for 12 weeks, while the control group of 11 men received a placebo pill that looked identical. The experiment was double-blind. The response variable is the decrease in systolic (top number) blood pressure for a subject after 12 weeks, in millimeters of mercury. An increase appears as a negative number. Do the data provide convincing evidence that a calcium supplement reduces blood pressure more than a placebo, on average, for subjects like the ones in this study? Group 1 (calcium) Group (placebo)…arrow_forward
 MATLAB: An Introduction with ApplicationsStatisticsISBN:9781119256830Author:Amos GilatPublisher:John Wiley & Sons Inc
 Probability and Statistics for Engineering and th...StatisticsISBN:9781305251809Author:Jay L. DevorePublisher:Cengage Learning
 Statistics for The Behavioral Sciences (MindTap C...StatisticsISBN:9781305504912Author:Frederick J Gravetter, Larry B. WallnauPublisher:Cengage Learning
 Elementary Statistics: Picturing the World (7th E...StatisticsISBN:9780134683416Author:Ron Larson, Betsy FarberPublisher:PEARSON
 The Basic Practice of StatisticsStatisticsISBN:9781319042578Author:David S. Moore, William I. Notz, Michael A. FlignerPublisher:W. H. Freeman
 Introduction to the Practice of StatisticsStatisticsISBN:9781319013387Author:David S. Moore, George P. McCabe, Bruce A. CraigPublisher:W. H. Freeman