
Probability and Statistics for Engineering and the Sciences
9th Edition
ISBN: 9781305251809
Author: Jay L. Devore
Publisher: Cengage Learning
expand_more
expand_more
format_list_bulleted
Videos
Textbook Question
Chapter 8.3, Problem 39E
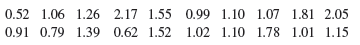
Reconsider the accompanying sample data on expense ratio (%) for large-cap growth mutual funds first introduced in Exercise 1.53.
A normal probability plot shows a reasonably linear pattern.
- a. Is there compelling evidence for concluding that the population mean expense ratio exceeds 1%? Carry out a test of the relevant hypotheses using a significance level of .01.
- b. Referring back to (a), describe in context type I and II errors and say which error you might have made in reaching your conclusion. The source from which the data was obtained reported that μ = 1.33 for the population of all 762 such funds. So did you actually commit an error in reaching your conclusion?
- c. Supposing that σ = .5, determine and interpret the power of the test in (a) for the actual value of μ slated in (b).
Expert Solution & Answer
Want to see the full answer?
Check out a sample textbook solution
Students have asked these similar questions
Consider the accompanying sample data on expense ratio (%) for large-cap growth mutual funds: 0.52 1.06 1.26 2.17 1.55 0.99 1.10 1.07 1.81 2.05 0.91 0.79 1.39 0.62 1.52 1.02 1.10 1.78 1.01 1.15
Is there compelling evidence for concluding that the population mean expense ratio exceeds 1%? Carry out a test of the relevant hypotheses using a significance level of 0.05.
Consider the following information:
Net working capital/total assets = 0.9
Retained earnings/total earnings = 0.15
EBIT/total assets = 1.1
MV of equity/BV of total liabilities = 2
Sales/total assets = 2.5
Required:
Compute the Z-score. Based on the calculation, explain whether there is a likelihood of financial distress?
Is there a difference in the yields of different types of investments? The accompanying data provide yields for a one-year certificate of deposit (CD) and a five-year CD for 25 banks. Complete parts a through c below.
a. Construct a 90% confidence interval estimate for the mean yield of one-year CDs.
Chapter 8 Solutions
Probability and Statistics for Engineering and the Sciences
Ch. 8.1 - For each of the following assertions, state...Ch. 8.1 - For the following pairs of assertions, indicate...Ch. 8.1 - For which of the given P-values would the null...Ch. 8.1 - Pairs of P-values and significance levels, , are...Ch. 8.1 - To determine whether the pipe welds in a nuclear...Ch. 8.1 - Let denote the true average radioactivity level...Ch. 8.1 - Before agreeing to purchase a large order of...Ch. 8.1 - Many older homes have electrical systems that use...Ch. 8.1 - Water samples are taken from water used for...Ch. 8.1 - A regular type of laminate is currently being used...
Ch. 8.1 - Prob. 11ECh. 8.1 - A mixture of pulverized fuel ash and Portland...Ch. 8.1 - The calibration of a scale is to be checked by...Ch. 8.1 - A new design for the braking system on a certain...Ch. 8.2 - Let denote the true average reaction time to a...Ch. 8.2 - Newly purchased tires of a particular type are...Ch. 8.2 - Answer the following questions for the tire...Ch. 8.2 - Reconsider the paint-drying situation of Example...Ch. 8.2 - The melting point of each of 16 samples of a...Ch. 8.2 - Lightbulbs of a certain type are advertised as...Ch. 8.2 - The desired percentage of SiO2 in a certain type...Ch. 8.2 - To obtain information on the corrosion-resistance...Ch. 8.2 - Automatic identification of the boundaries of...Ch. 8.2 - Unlike most packaged food products, alcohol...Ch. 8.2 - Body armor provides critical protection for law...Ch. 8.2 - Prob. 26ECh. 8.2 - Show that for any 0, when the population...Ch. 8.2 - For a fixed alternative value , show that () 0 as...Ch. 8.3 - The true average diameter of ball bearings of a...Ch. 8.3 - A sample of n sludge specimens is selected and the...Ch. 8.3 - The paint used to make lines on roads must reflect...Ch. 8.3 - The relative conductivity of a semiconductor...Ch. 8.3 - The article The Foremans View of Quality Control...Ch. 8.3 - The following observations are on stopping...Ch. 8.3 - The article Uncertainty Estimation in Railway...Ch. 8.3 - Have you ever been frustrated because you could...Ch. 8.3 - The accompanying data on cube compressive strength...Ch. 8.3 - A random sample of soil specimens was obtained,...Ch. 8.3 - Reconsider the accompanying sample data on expense...Ch. 8.3 - Polymer composite materials have gained popularity...Ch. 8.3 - A spectrophotometer used for measuring CO...Ch. 8.4 - Prob. 42ECh. 8.4 - Prob. 43ECh. 8.4 - A manufacturer of nickel-hydrogen batteries...Ch. 8.4 - A random sample of 150 recent donations at a...Ch. 8.4 - It is known that roughly 2/3 of all human beings...Ch. 8.4 - The article Effects of Bottle Closure Type on...Ch. 8.4 - With domestic sources of building supplies running...Ch. 8.4 - A plan for an executive travelers club has been...Ch. 8.4 - Each of a group of 20 intermediate tennis players...Ch. 8.4 - A manufacturer of plumbing fixtures has developed...Ch. 8.4 - In a sample of 171 students at an Australian...Ch. 8.5 - Reconsider the paint-drying problem discussed in...Ch. 8.5 - Consider the large-sample level .01 test in...Ch. 8.5 - Consider carrying out m tests of hypotheses based...Ch. 8.5 - Prob. 56ECh. 8 - A sample of 50 lenses used in eyeglasses yields a...Ch. 8 - In Exercise 57, suppose the experimenter had...Ch. 8 - It is specified that a certain type of iron should...Ch. 8 - One method for straightening wire before coiling...Ch. 8 - Contamination of mine soils in China is a serious...Ch. 8 - The article Orchard Floor Management Utilizing...Ch. 8 - The article Caffeine Knowledge, Attitudes, and...Ch. 8 - Annual holdings turnover for a mutual fund is the...Ch. 8 - The true average breaking strength of ceramic...Ch. 8 - Prob. 66SECh. 8 - The incidence of a certain type of chromosome...Ch. 8 - Prob. 68SECh. 8 - Prob. 69SECh. 8 - The Dec. 30, 2009. the New York Times reported...Ch. 8 - When X1, X2,, Xn are independent Poisson...Ch. 8 - An article in the Nov. 11, 2005, issue of the San...Ch. 8 - Prob. 73SECh. 8 - The article Analysis of Reserve and Regular...Ch. 8 - Prob. 75SECh. 8 - Chapter 7 presented a CI for the variance 2 of a...Ch. 8 - Prob. 77SECh. 8 - When the population distribution is normal and n...Ch. 8 - Let X1, X2, Xn be a random sample from an...Ch. 8 - Because of variability in the manufacturing...
Knowledge Booster


Learn more about
Need a deep-dive on the concept behind this application? Look no further. Learn more about this topic, statistics and related others by exploring similar questions and additional content below.Similar questions
- 1. A study by a bank compared the average savings of customers who were depositors for three years or less with those who had been depositors for more than three years. The results of a sample are: less than equal to 3 years greater than 3 years Mean Savings Balance $1,200 $1,250 Population Standard deviation $100 $150 Sample Size 10 15 To test that the two groups of customers have equal savings rates, what is the p-value for a two-tailed test? 2. A financial planner wants to compare the yield of income and growth mutual funds. Fifty thousand dollars is invested in each of a sample of 35 income and 40 growth funds. The mean increase for a two-year period for the income funds is $900. For the growth funds, the mean increase is $875. Income funds have a sample standard deviation of $35; growth funds have a sample standard deviation of $45. Assume that the population standard deviations are equal. At the 0.05 significance level, is there a difference in the mean yields of…arrow_forwardExtending the Concepts and SkillsShow that, for two populations, MSE=Sp2, where Sp2 is the p√ooled variance defined in Section 10.2 on page 447. Conclude that MSE is the pooled sample standard deviation, sp.arrow_forwardFowle Marketing Research, Inc., bases charges to a client on the assumption that telephone surveys can be completed in a mean time of 15 minutes or less. If a longer mean survey time is necessary, a premium rate is charged. A sample of 35 surveys from a particular client provided the survey times shown in the file named Fowle. Based upon past studies, the population standard deviation is assumed known with σ = 4 minutes. Is the premium rate justified for this client? 17 11 12 23 20 23 15 16 23 22 18 23 25 14 12 12 20 18 12 19 11 11 20 21 11 18 14 13 13 19 16 10 22 18 23 (a) Formulate the null and alternative hypotheses for this application. H0: μ < 15 Ha: μ ≥ 15 H0: μ ≤ 15 Ha: μ > 15 H0: μ = 15 Ha: μ ≠ 15 H0: μ > 15 Ha: μ ≤ 15 H0: μ ≥ 15 Ha: μ < 15 (b) Compute the value of the test statistic. (Round your answer to two decimal places.) (c) What is the p-value? (Round your answer to four decimal places.) p-value = (d) At…arrow_forward
- The superintendent of a large school district, having once had a course in probability and statistics, believes that the number of teachers absent on any given day has a Poisson distribution with parameter ?. Use the accompanying data on absences for 50 days to obtain a 95% large-sample CI for ?. Number of absences 0 1 2 3 4 5 6 7 8 9 10 Frequency 2 4 8 11 8 6 6 2 1 1 1 [Hint: The mean and variance of a Poisson variable both equal ?, so Z = X − ? ?/n has approximately a standard normal distribution. Now proceed as in the derivation of the interval for p by making a probability statement (with probability 1 − ?) and solving the resulting inequalities for ?.] (Round your answers to two decimal places.) ,arrow_forwardA risk manager is analyzing a 1-day 98% VaR model. Assuming 252 days in a year, what is the maximum number of daily losses exceeding the 1-day 98% VaR that is acceptable in a 1-year backtest to conclude, at a 95% confidence level, that the model is calibrated correctly? a)5 b)9 c)10 d)12arrow_forward1. A recent survey showed that from a sample of 500 packages delivered by a Postal Service, 480were delivered on time. a) Construct a 95% confidence interval for the proportion of all packages that are deliveredon time by the Postal Service.arrow_forward
- Use the Data Below: A) A potential car buyer is undecided on whether to buy a 2012 car with a front-wheel-drive (F) or with a rear-wheel-drive (R). Obtain the fuel efficiency mean, standard deviation, and the number of observations included in the sample for each type of these systems. B) Construct and interpret a 95% confidence interval for the true difference inmean city mileage (MPG) between front wheel drive (F) and rear wheel drive (R) systems. Assume that MPG of front wheel drive and rear wheel drive cars follow a normal distribution. *Note: You can use Excel or Rstudio or any means necessary comb_mpg drive_sys 13 R 16 R 16 R 15 R 16 R 27 R 27 R 19 R 21 R 19 R 18 R 19 R 17 R 18 R 12 R 23 R 25 R 24 R 17 R 14 R 26 R 26 R 23 R 22 R 16 R 16 R 36 R 36 R 22 R 21 R 21 R 20 R 21 R 24 R 22 R 23 R 22 R 23 R 22 R 24 R 22 R 23 R 22 R 23 R 22 R 15 R 13 R 14 R 13 R 15 R 19 R 17 R 17 R…arrow_forwardThe article “Uncertainty Estimation in Railway TrackLife-Cycle Cost” (J. of Rail and Rapid Transit, 2009)presented the following data on time to repair (min) a railbreak in the high rail on a curved track of a certain railway line.159 120 480 149 270 547 340 43 228 202 240 218A normal probability plot of the data shows a reasonably linear pattern, so it is plausible that the populationdistribution of repair time is at least approximately normal. The sample mean and standard deviation are 249.7 and 145.1, respectively. a. Is there compelling evidence for concluding that trueaverage repair time exceeds 200 min? Carry out atest of hypotheses using a significance level of .05. b. Using std= 150, what is the type II error probabilityof the test used in (a) when true average repair timeis actually 300 min? That is, what is b(300)?arrow_forward
arrow_back_ios
arrow_forward_ios
Recommended textbooks for you
 MATLAB: An Introduction with ApplicationsStatisticsISBN:9781119256830Author:Amos GilatPublisher:John Wiley & Sons Inc
 Probability and Statistics for Engineering and th...StatisticsISBN:9781305251809Author:Jay L. DevorePublisher:Cengage Learning
 Statistics for The Behavioral Sciences (MindTap C...StatisticsISBN:9781305504912Author:Frederick J Gravetter, Larry B. WallnauPublisher:Cengage Learning
 Elementary Statistics: Picturing the World (7th E...StatisticsISBN:9780134683416Author:Ron Larson, Betsy FarberPublisher:PEARSON
 The Basic Practice of StatisticsStatisticsISBN:9781319042578Author:David S. Moore, William I. Notz, Michael A. FlignerPublisher:W. H. Freeman
 Introduction to the Practice of StatisticsStatisticsISBN:9781319013387Author:David S. Moore, George P. McCabe, Bruce A. CraigPublisher:W. H. Freeman
MATLAB: An Introduction with Applications
Statistics
ISBN:9781119256830
Author:Amos Gilat
Publisher:John Wiley & Sons Inc
Probability and Statistics for Engineering and th...
Statistics
ISBN:9781305251809
Author:Jay L. Devore
Publisher:Cengage Learning
Statistics for The Behavioral Sciences (MindTap C...
Statistics
ISBN:9781305504912
Author:Frederick J Gravetter, Larry B. Wallnau
Publisher:Cengage Learning
Elementary Statistics: Picturing the World (7th E...
Statistics
ISBN:9780134683416
Author:Ron Larson, Betsy Farber
Publisher:PEARSON
The Basic Practice of Statistics
Statistics
ISBN:9781319042578
Author:David S. Moore, William I. Notz, Michael A. Fligner
Publisher:W. H. Freeman
Introduction to the Practice of Statistics
Statistics
ISBN:9781319013387
Author:David S. Moore, George P. McCabe, Bruce A. Craig
Publisher:W. H. Freeman
Hypothesis Testing using Confidence Interval Approach; Author: BUM2413 Applied Statistics UMP;https://www.youtube.com/watch?v=Hq1l3e9pLyY;License: Standard YouTube License, CC-BY
Hypothesis Testing - Difference of Two Means - Student's -Distribution & Normal Distribution; Author: The Organic Chemistry Tutor;https://www.youtube.com/watch?v=UcZwyzwWU7o;License: Standard Youtube License