
Concept explainers
Videos
To review:
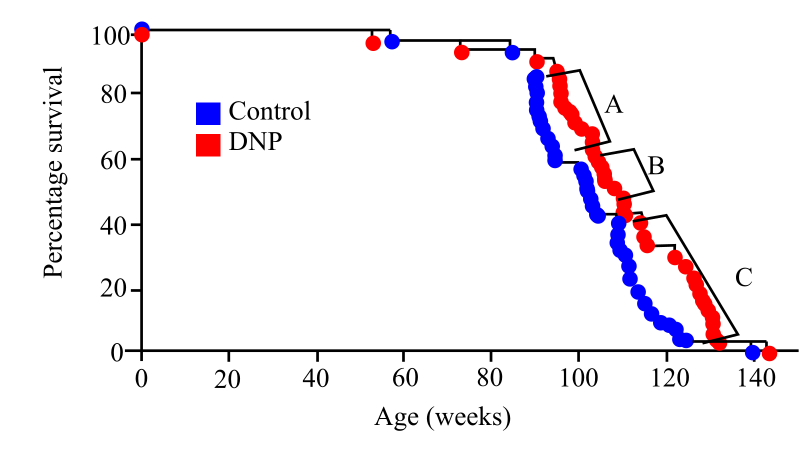
From the given graph and study, the investigators determined that a low concentration of DNP increased the average life span from 719 days (Control) to 770 days (DNP). If the U.S. population has an average life span of 79 years, then how many years would be added if the same percentage increase were observed.
Introduction:
The 2,4-dinitrophenol (DNP) is used for the mice for reducing the production of reactive oxygen species (ROS), which allows the free passage of the protons across the inner mitochondrial membrane. The rate of survival is increased in the DNP treated mice as the oxidative damage caused by the ROS is decreased by the drug. The effect of a drug called DNP on the life span of mice is shown in the graph below. Each point represents the death of a single mouse.
Want to see the full answer?
Check out a sample textbook solution
Chapter 9 Solutions
Biological Science (6th Edition)


- 24 rabbits were brought to Australia in 1859 and 6 years later there were 240,000. What is the intrinsic rate of increase?arrow_forwardin response to this question, could you explain why in Step 3, R became 0.500 and why in Step 4, Vmax is sudden multiplied by 10^-3? It's unclear in the responsearrow_forwardHow many lactate dehydrogenase alleles are there in this insect population? A. 1 B. 2 C. 3 D. 4 E. 5 Following up on Question 1, is this insect population in Hardy-Weinberg equilibrium? A. Yes B. No C. No way to tellarrow_forward
- You are asked to form a general population equation? How would you form this?arrow_forwardUsing the data below, calculate the correlation: covariance -0.9 standard deviation(x) = 10.5 standard deviation(y) = 10.4 (calculate to 2 significant figures)arrow_forwardConsider the variables: A, B, C, D, E, F, G, and H. A and B, B and C, C and D are directly related while D and E, E and F, F and G, and G and H are inversely related. If an initial increase occurs in the value of A, the value of H will a. decrease b. increase c. stay the same d. cannot predict from the given informationarrow_forward
- A particular specie of animal has a carrying capacity of K and a growth rate of r. From an initial population of N0, what will be its population after a very long time? Show your calculations.arrow_forwardCan you explain it? How can you determine the answer just by the data provided? Not by plotting any graph. If possible, can you provide the graph?arrow_forwardSuppose you want to examine the effect of a fertilizer on the size of eggplant produced, and therefore, you need to establish the experimental and control groups. A. What could represent the control group? B. What will be your experimental group? C. What will be the best way to establish a relationship between your two variables?arrow_forward
- The type of growth that occurs in a population that grows by a constant percentage per year is________ . Does this form of growth add the same number of individuals each year?_______ What shape of curve is generated if this type of growth is graphed?______ Can this type of growth be sustained indefinitely?______arrow_forwardwhich of the following is an example of quantitive data? the freshman class of the students contained 643 students, 372 males, and 271 females. the absorption peak of cobalt chloride was 510nm bromelain has optimal enzyme activity at a pH of 7 the color of cobalt chloride was pink the mass of the onion was 50 grams A scientist is measuring blood glucose levels of two individuals over time, which of the following types of graphs would best be suited to display the data. line graph bar graph pie graph all the above None of the above 11,.what is the purpose of homogenization? it increases the absorption of DNA molecules it decreases the amount of DNA that can be spooled onto a straw it releases the DNA from the nuclei by breaking apart the cell walls, plasma membrane, and nuclear envelopes. it removes attached proteins from DNA it removes attached carbohydrates from DNAarrow_forwardCreate/draw a graph that represents a population undergoing exponential growth. Properly label the x and y-axis of your graphs.arrow_forward
