
Videos
The antibiotic gentamicin sulphate is often blended with acrylic bone cement to help prevent infection following joint replacement surgery. The article “Incorporation of Large Amounts of Gentamicin Sulphate Into Acrylic Bone Cement: Effect on Handling and Mechanical Properties, Antibiotic Release, and Biofilm Formation” (N. Dunne, P. McAfee, ct al., Journal of Engineering in Medicine. 2008:355–365) presents a study of the effect of the amount of antibiotic added on various properties of the cement. Following are measurements of the setting time of the cement, for six levels of antibiotic amount, and three replications per level. The measurements are consistent with means and standard deviations presented in the article.
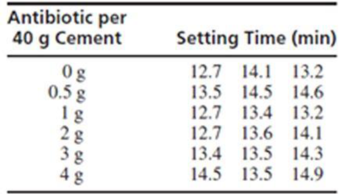
- a. Construct an ANOVA table. You may give a
range for the P-value. - b. Can you conclude that there are differences among the
mean setting times?
Want to see the full answer?
Check out a sample textbook solution
Chapter 9 Solutions
EBK STATISTICS FOR ENGINEERS AND SCIENT
Additional Math Textbook Solutions
Business Statistics: A First Course (8th Edition)
Research Methods for the Behavioral Sciences (MindTap Course List)
Statistical Techniques in Business and Economics
Business Statistics: A First Course (7th Edition)


- The depth of wetting of a soil is the depth to which water content will increase owing to extemal factors. The article "Discussion of Method for Evaluation of Depth of Wetting in Residential Areas" (J. Nelson, K. Chao, and D. Overton, Journal of Geotechnical and Geoenvironmental Engineering, 2011:293-296) discusses the relationship between depth of wetting beneath a structure and the age of the structure. The article presents measurements of depth of wetting, in meters, and the ages, in years, of 21 houses, as shown in the following table. Age Depth 7.6 4 4.6 6.1 9.1 3 4.3 7.3 5.2 10.4 15.5 5.8 10.7 4 5.5 6.1 10.7 10.4 4.6 7.0 6.1 14 16.8 10 9.1 8.8 Compute the least-squares line for predicting depth of wetting (y) from age (x). b. Identify a point with an unusually large x-value. Compute the least-squares line that results from deletion of this point. Identify another point which can be classified as an outlier. Compute the least-squares line that results from deletion of the outlier,…arrow_forwardThe article "Effect of Granular Subbase Thickness on Airfield Pavement Structural Response" (K. Gopalakrishnan and M. Thompson, Journal of Materials in Civil Engineering, 2008:331-342) presents a study of the amount of surface deflection caused by aircraft landing on an airport runway. A load of 160 kN was applied to a runway surface, and the amount of deflection in mm (y) was measured at various distances in m (x) from the point of application. The results are presented in the following table. y 0.000 3.24 0.305 2.36 0.610 1.42 0.914 0.87 1.219 0.54 1.524 0.34 1.830 0.24 a. Fit the linear model y = Bo + B1x + ɛ. For each coefficient, test the hypothesis that the coefficient is equal to 0. b. Fit the quadratic model y = Bo + Bịx + B2x² + ɛ. For each coefficient, test the hypothesis that the coefficient is equal to 0. %3D Fit the cubic model y = Bo + B1x + B2x? + B3x + E. For each coefficient, test the C. hypothesis that the coefficient is equal to 0. d. Which of the models in parts (a)…arrow_forwardThe article "Effect of Granular Subbase Thickness on Airfield Pavement Structural Response" (K. Gopalakrishnan and M. Thompson, Journal of Materials in Civil Engineering, 2008:331-342) presents a study of the effect of the subbase thickness (in mm) on the amount of surface deflection caused by aircraft landing on an airport runway. Two landing gears, one simulating a Boeing 747 aircraft, and the other a Boeing 777 aircraft, were trafficked across four test sections of runway. The results are presented in the following table. Section 3 4 Boeing 747 Boeing 777 4.01 3.87 3.72 3.76 4.57 4.48 4.36 4.43 Can you conclude that the mean deflection is greater for the Boeing 777?arrow_forward
- The article "Experimental Measurement of Radiative Heat Transfer in Gas-Solid Suspension Flow System" (G. Han, K. Tuzla, and J. Chen, AIChe Journal, 2002:1910- 1916) discusses the calibration of a radiometer. Several measurements were made on the electromotive force readings of the radiometer (in volts) and the radiation flux (in kilowatts per square meter). The results (read from a graph) are presented in the following table. Heat flux (y) 15 31 51 55 67 89 Signal output (x) 1.08 2.42 4.17 4.46 5.17 6.92 Compute the least-squares line for predicting heat flux from the signal output. If the radiometer reads 3.00 V, predict the heat flux. If the radiometer reads 8.00 V, should the heat flux be predicted? If so, predict it. If not, explain why. C.arrow_forwardPlease show me your solutions and interpretations. Show the completehypothesis-testing procedure.An article in the ASCE Journal of Energy Engineering (1999, Vol. 125, pp. 59–75) describes a study of the thermal inertia properties of autoclaved aerated concrete used as a building material. Five samples of the material were tested in a structure, and the average interior temperatures (°C) reported were as follows: 23.01, 22.22, 22.04, 22.62, and 22.59. Test that the average interior temperature is equal to 22.5 °C using α = 0.05.arrow_forwardThe article “Effect of Granular Subbase Thickness on Airfield Pavement Structural Response” (K. Gopalakrishnan and M. Thompson, Journal of Materials in Civil Engineering, 2008:331–342) presents a study of the effect of the subbase thickness on the amount of surface deflection caused by aircraft landing on an airport runway. In six applications of a 160 kN load on a runway with a subbase thickness of 864 mm, the average surface deflection was 2.03 mm with a standard deviation of 0.090 mm. Find a 90% confidence interval for the mean deflection caused by a 160 kN load.arrow_forward
- In the article “Assessment of Dermatopharmacokinetic Approach in the Bioequivalence Determination of Topical Tretinoin Gel Products” (L. Pershing, J. Nelson, et al., Journal of the American Academy of Dermatology, 2003:740-751), measurements of the concentration of an anti-fungal gel, in ng per square centimeter of skin, were made one hour after application for 49 individuals. Following are the results. The authors claim that these data are well-modeled by a lognormal distribution. Construct an appropriate probability plot, and use it to determine whether the data support this claim. 132.44 76.73258.46177.46 73.01130.62235.63 107.54 75.95 70.37 88.76104.00 19.07174.30 82.87 68.73 41.47120.44136.52 82.46 67.04 96.92 93.26 72.92138.15 82.43245.41104.68 82.53122.59147.12129.82 54.83 65.82 75.24 135.52132.21 85.63135.79 65.98349.71 77.84 89.19102.94166.11168.76155.20 44.35202.51 Figure 4.23 (page 288) shows that nonnormal data can sometimes be made approximately normal by applying an…arrow_forwardIn "Orthogonal Design for Process Optimization and Its Application to Plasma Etching" (Solid State Technology, May 1987), G. Z. Yin and D. W. Jillie describe an experiment to determine the effect of C2Fe flow rate on the uniformity of the etch on a silicon wafer used in integrated circuit manufacturing. Three flow rates are used in the experiment, and the resulting uniformity (in percent) for six replicates is shown below. Observations C„F. Flow (SCCM) 2 3 4 5 125 2.5 4.4 2.6 3.2 3.2 4.0 160 4.8 4.4 4.8 4.2 3.6 4.2 200 4.6 3.3 2.8 3.4 4.2 5.3 (a) Does C,F, flow rate affect etch uniformity? Construct box plots to compare the factor levels and perform the analysis of variance. Use a = 0.05. There is that flow rate affects etch uniformity. (b) Do the residuals indicate any problems with the underlying assumptions? No. Statistical Tables and Charts Yes.arrow_forwardAdding glass particles to clay brick may improve the structural properties of the brick. The article "Effects of Waste Glass Additions on the Properties and Durability of Fired Clay Brick" (S. Chidiac and L. Federico, Can J Civ Eng, 2007:1458–1466) describes experiments in which the compressive strength (in MPa) was measured for bricks with varying amounts of glass content and glass particle size. The results in the following table are consistent with means and standard deviations presented in the article. Glass Content (%) Strength (MPa) Size 5 Coarse 78.7 70.8 78.6 81.7 79.2 5 Fine 73.0 90.1 71.4 93.8 82.7 10 Coarse 80.1 76.9 76.5 84.3 77.7 10 Fine 76.2 80.1 121.2 81.4 61.2 15 Coarse 90.3 95.8 103.1 99.5 73.3 15 Fine 141.1 144.1 122.4 134.5 124.9 a. Estimate all main effects and interactions. b. Construct an ANOVA table. You may give ranges for the P-values. Is the additive model plausible? Provide the value of a test statistic and the P-value. Can the effect of glass content on…arrow_forward
- The article "Permeability, Diffusion and Solubility of Gases" (B. Flaconnèche, et al., Oil and Gas Science and Technology, 2001:262–278) reported on a study of the effect of temperature and other factors on gas transport coefficients in semicrystalline polymers. The permeability coefficient (in 10-6 cm³ (STP) / cm · s· MPa) of CO, was measured for extruded medium-density polyethylene at both 60°C and 61°C. The results are as follows: 60°C: 54 51 61 67 57 69 60 60 63 62 61°C: 58 60 66 66 68 61 60 Find a 95% confidence interval for the difference in the permeability coefficent between 60°C and 61°C.arrow_forwardThe article "Experimental Design Approach for the Optimization of the Separation of Enantiomers in Preparative Liquid Chromatography" (S. Lai and Z. Lin, Separation Science and Technology, 2002: 847–875) describes an experiment involving a chemical process designed to separate enantiomers. A model was fit to estimate the cycle time (y) in terms of the flow rate (x1), sample concentration (x2), and mobile-phase composition (x3). The results of a least-squares fit are presented in the following table. (The article did not provide the value of the t statistic for the constant term.) Predictor Coefficient т Constant 1.603 X1 -0.619 -22.289 0.000 X2 0.086 3.084 0.018 0.306 11.011 0.000 0.272 8.542 0.000 0.057 1.802 0.115 0.105 3.300 0.013 X1X2 -0.022 -0.630 0.549 XXз -0.036 -1.004 0.349 X>Xз 0.036 1.018 0.343 Of the following, which is the best next step in the analysis? i. Nothing needs to be done. This model is fine. Drop x;, x;, and x from the model, and then perform an F test. iii. Drop…arrow_forwardThe article "Modeling Resilient Modulus and Temperature Correction for Saudi Roads" (H. Wahhab, I. Asi, and R. Ramadhan, Journal of Materials in Civil Engineering, 2001:298– 305) describes a study designed to predict the resilient modulus of pavement from physical properties. The following table presents data for the resilient modulus at 40°Cin10® kPa (y), the surface area of the aggregate in m²/kg (x1), and the softening point of the asphalt in °C (х). y X1 X2 1.48 5.77 60.5 1.70 7.45 74.2 2.03 8.14 67.6 2.86 8.73 70.0 2.43 7.12 64.6 3.06 6.89 65.3 2.44 8.64 66.2 1.29 6.58 64.1 3.53 9.10 68.6 1.04 8.06 58.8 1.88 5.93 63.2 1.90 8.17 62.1 1.76 9.84 68.9 2.82 7.17 72.2 1.00 7.78 54.1 The full quadratic model is y = + P,x, + PzX, + Pz*jXz + Pxx¡ + Bzx; + €. Which submodel of this full model do you believe is most appropriate? Justify your answer by fitting two or more models and comparing the results.arrow_forward
 MATLAB: An Introduction with ApplicationsStatisticsISBN:9781119256830Author:Amos GilatPublisher:John Wiley & Sons Inc
 Probability and Statistics for Engineering and th...StatisticsISBN:9781305251809Author:Jay L. DevorePublisher:Cengage Learning
 Statistics for The Behavioral Sciences (MindTap C...StatisticsISBN:9781305504912Author:Frederick J Gravetter, Larry B. WallnauPublisher:Cengage Learning
 Elementary Statistics: Picturing the World (7th E...StatisticsISBN:9780134683416Author:Ron Larson, Betsy FarberPublisher:PEARSON
 The Basic Practice of StatisticsStatisticsISBN:9781319042578Author:David S. Moore, William I. Notz, Michael A. FlignerPublisher:W. H. Freeman
 Introduction to the Practice of StatisticsStatisticsISBN:9781319013387Author:David S. Moore, George P. McCabe, Bruce A. CraigPublisher:W. H. Freeman