
Concept explainers
Videos
Stress in cows prior to slaughter. What is the level of stress (if any) that cows undergo prior to being slaughtered? To answer this question, researchers designed an experiment involving cows bred in Normandy. France (Applied Animal Behaviour Science, June 2010). The heart rate (beats per minute) of a cow was measured at four different pre-slaughter phases—(1) first phase of visual contact with pen mates. (2) initial isolation from pen mates for prepping, (3) restoration of visual contact with pen mates, and (4) first contact with human prior to slaughter. Data for eight cows (simulated from information provided in the article) are shown in the accompanying table. The researchers analyzed the data using an analysis of variance for a randomized block design. Their objective was to determine whether the mean heart rate of cows differed in the four pre-slaughter phases.
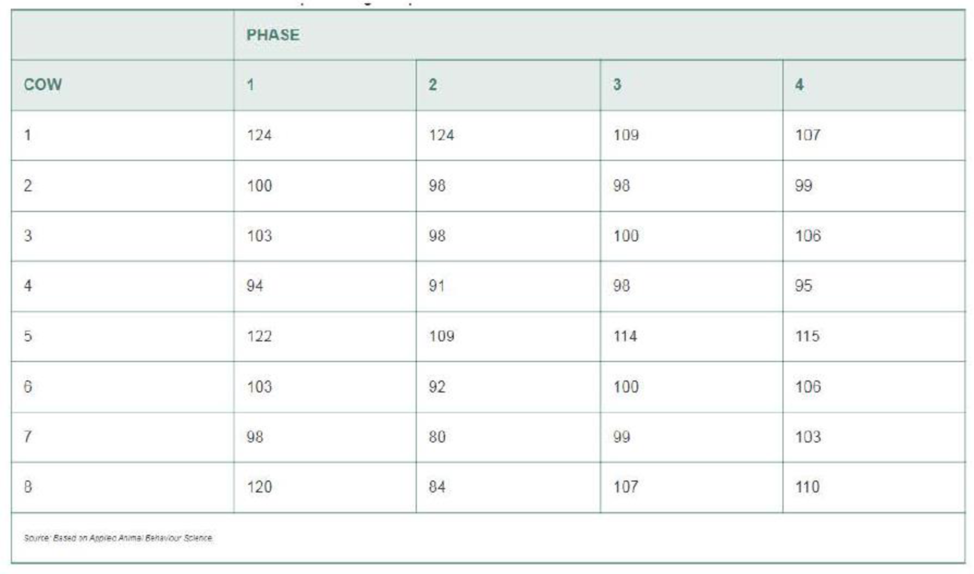
- a. Identify the treatments and blocks for this experimental design.
- b. Conduct the appropriate analysis using a statistical software package. Summarize the results in an ANOVA table.
- c. Is there evidence of differences among the mean heart rates of cows in the four pre-slaughter phases? Test using α = .05.
- d. If warranted, conduct a multiple comparisons procedure to rank the four treatment means. Use an experimentwise error rate of α = .05.
Want to see the full answer?
Check out a sample textbook solution
Chapter 9 Solutions
Statistics, Books a la Carte Edition (13th Edition)


- What does the y -intercept on the graph of a logistic equation correspond to for a population modeled by that equation?arrow_forwardResearchers interested in lead exposure due to car exhaust sampled the blood of 52 police officers subjected to constant inhalation of automobile exhaust fumes while working traffic enforcement in a primarily urban environment. The blood samples of these officers had an average lead concentration of 124.32 µg/l and a SD of 37.74 µg/l; a previous study of individuals from a nearby suburb, with no history of exposure, found an average blood level concentration of 35 µg/l. Test the hypothesis that the downtown police officers have a higher lead exposure than the group in the previous study. Interpret your results in context. Based on your preceding result, without performing a calculation, would a 99% confidence interval for the average blood concentration level of police officers contain 35 µg/l? Based on your preceding result, without performing a calculation, would a 99% confidence interval for this difference contain 0? Explain why or why not.arrow_forwardStressed-Out Bus Drivers. Previous studies have shown that urban bus drivers have an extremely stressful job, and a large proportion of drivers retire prematurely with disabilities due to occupational stress. In the paper, “Hassles on the Job: A Study of a Job Intervention With Urban Bus Drivers” (Journal of Organizational Behavior, Vol. 20, pp. 199–208), G. Evans et al. examined the effects of an intervention program to improve the conditions of urban bus drivers.Amongother variables, the researchers monitored diastolic blood pressure of bus drivers in downtown Stockholm, Sweden. The data, in millimeters of mercury (mm Hg), on the WeissStats site are based on the blood pressures obtained prior to intervention for the 41 bus drivers in the study. Use the technology of your choice to do the following. a. Obtain a normal probability plot, boxplot, histogram, and stemand-leaf diagram of the data. b. Based on your results from part (a), can you reasonably apply the one-mean t-test to the…arrow_forward
- A researcher conducts a two-year study comparing the number of cavities in a group of 30 randomly selected young children from the community before and after the application of fluoride to test if there is a decrease in the number of cavities. This is an example of a/an: Independent-samples t test or Dependent-samples t test?arrow_forwardWe are testing whether a particular program of low impact exercise can improve the cholesterol level of stroke patients. We enroll a group of stroke patients in our study, and after six weeks we measure their serum cholesterol level in mmol/L, resulting in the following data: 6.1 9.3 6.3 4 9 5.5 6.3 4.2 4.7 7.8 4.3 7.5 9.1 4.2 6.9 8.1 5.6 9.4 8.3 8.8 7.2 5.7 6.5 3.8 3.8 9 9.4 4.5 8 7 4.5 9.4 6.6 4.1 6.6 9.1 3.9 5.3 (a) Construct a 95% confidence interval. _______< u < ______ From an existing study, we know that the average cholesterol level of all stroke patients is 7 mmol/L. We want to know if the level in our patients is significantly different from this. (b) What is our Test statistic? ______ (c) What is the two-tailed p-value of this result? ______arrow_forwardA study of the effect of caffeine on muscle metabolism used eighteen male volunteers who each underwent arm exercise tests. Nine of the men were randomly selected to take a capsule containing pure caffeine one hour before the test. The other men received a placebo capsule. During each exercise the subject's respiratory exchange ratio (RER) was measured. (RER is the ratio of CO2 produced to O2 consumed and is an indicator of whether energy is being obtained from carbohydrates or fats). Does the data provide evidence that caffeine does, on average, reduce RER? Placebo Caffeine 104 96 119 100 100 94 97 89 98 96 103 93 94 89 95 105 98 88 Mean 100.89 94.44 Variance 57.11 31.28arrow_forward
 Linear Algebra: A Modern IntroductionAlgebraISBN:9781285463247Author:David PoolePublisher:Cengage Learning
 Glencoe Algebra 1, Student Edition, 9780079039897...AlgebraISBN:9780079039897Author:CarterPublisher:McGraw Hill