Concept explainers
Videos
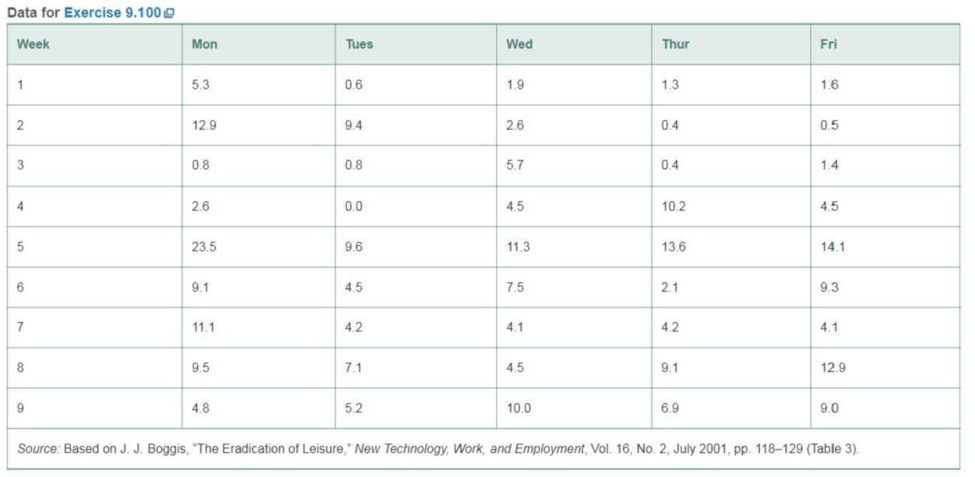
Absentee rates at a jeans plant. A plant that manufactures denim jeans in the United Kingdom introduced a computerized automated handling system. The new system delivers garments to the assembly line operators by means of an overhead conveyor. Although the automated system minimizes operator handling time, it inhibits operators from working ahead and taking breaks from their machine. A study in New Technology, Work, and Employment (July 2001) investigated the impact of the new handling system on worker absentee rates at the jeans plant. One theory is that the mean absentee rate will vary by day of the week, as operators decide to indulge in 1-day absences to relieve work pressure. Nine weeks were randomly selected, and the absentee rate (percentage of workers absent) determined for each day (Monday through Friday) of the workweek. The data are listed in the table at the top of the next column. Conduct a complete analysis of the data to determine whether the mean absentee rate differs across the 5 days of the workweek.
Want to see the full answer?
Check out a sample textbook solution
Chapter 9 Solutions
Statistics, Books a la Carte Edition (13th Edition)


- Knowing that people have a tendency to engage in social loafing when they think there are other people around to take some of the burden, researchers think that knowing they are “alone” versus “together” will impact the way a participant performs during a tug-of-war task. In the “alone” condition, participants are blindfolded and asked to pull as hard as they can on a rope against another participant on the other end. In the “together” condition, participants are once again blindfolded and told to pull as hard as they can. However, they are led to believe that there are three people on each end of the rope (they have two team additional team members to help them). The researchers find that those in the “alone” condition pull much harder (as measured by a weight sensor that measures pounds per square inch on a scale from 0 to 500 pounds) than those in the “together” condition. Which of the following is the independent variable? Pulling strength Weight sensor Social loafing…arrow_forwardKnowing that people have a tendency to engage in social loafing when they think there are other people around to take some of the burden, researchers think that knowing they are “alone” versus “together” will impact the way a participant performs during a tug-of-war task. In the “alone” condition, participants are blindfolded and asked to pull as hard as they can on a rope against another participant on the other end. In the “together” condition, participants are once again blindfolded and told to pull as hard as they can. However, they are led to believe that there are three people on each end of the rope (they have two team additional team members to help them). The researchers find that those in the “alone” condition pull much harder (as measured by a weight sensor that measures pounds per square inch on a scale from 0 to 500 pounds) than those in the “together” condition. Which of the following is the null hypothesis? Those alone will not differ in their pulling strength compared…arrow_forwardKnowing that people have a tendency to engage in social loafing when they think there are other people around to take some of the burden, researchers think that knowing they are “alone” versus “together” will impact the way a participant performs during a tug-of-war task. In the “alone” condition, participants are blindfolded and asked to pull as hard as they can on a rope against another participant on the other end. In the “together” condition, participants are once again blindfolded and told to pull as hard as they can. However, they are led to believe that there are three people on each end of the rope (they have two team additional team members to help them). The researchers find that those in the “alone” condition pull much harder (as measured by a weight sensor that measures pounds per square inch on a scale from 0 to 500 pounds) than those in the “together” condition. Which of the following is the alternative hypothesis? Those alone will not differ in their pulling strength…arrow_forward
- For 25 years, Arthur Reynolds and Judy Temple tracked more than 1,400 children who participated in a publicly funded early childhood development program beginning at age 3. They found that children who participated in the program showed higher levels of educational attainment, socioeconomic status, and job skills, as well as lower rates of substance abuse, felony arrest, and incarceration, than those who did not receive school-based early education. One possible theory for the success of this program is that improving school readiness improved the children's success in school. The improved success in school in turn improved their readiness for adulthood, resulting in increased job skills and socioeconomic status as well as lower rates of substance abuse.arrow_forwardFor 25 years, Arthur Reynolds and Judy Temple tracked more than 1,400 children who participated in a publicly funded early childhood development program beginning at age 3. They found that children who participated in the program showed higher levels of educational attainment, socioeconomic status, and job skills, as well as lower rates of substance abuse, felony arrest, and incarceration, than those who did not receive school-based early education. One possible theory for the success of this program is that improving school readiness improved the children's success in school. The improved success in school in turn improved their readiness for adulthood, resulting in increased job skills and socioeconomic status as well as lower rates of substance abuse. What is the independent and dependent variable?arrow_forwardThe administrator of Hope Hospital has been asked to perform an activity analysis of the emergency room (ER). The ER activities include cost of quality and other patient care activities. The lab tests and transportation are hospital services external to the ER for determining external failure costs. The result of the activity analysis is summarized as follows: Activities Activity Cost Patient registration $6,400 Verifying patient information 9,600 Assignment patients 12,800 Searching/waiting for doctor 8,000 Doctor exam 4,800 Waiting for transport 17,600 Transporting patients 16,000 Verifying lab orders 14,400 Searching for equipment 8,000 Incorrect labs 12,800 Lab tests 17,600 Counting supplies 19,200 Looking for supplies 8,000 Staff training 4,800 Total 160,000 Problem 2 Instructions Prepare a Pareto chart of the ER activities. Classify the activities into…arrow_forward
- In terms of the model parameters, state the null hypothesis that, after controlling for sales and roe, ros has no effect on CEO salary. State the alternative that better stock market performance increases a CEO’s salary.arrow_forwardA soft drink bottler is analyzing the vending machine service routes in his distribution system.He is interested in predicting the amount of time required by the route driver to service thevending machines in an outlet. This service activity includes stocking the machine with beverageproducts and minor maintenance or housekeeping. The industrial engineer responsible for thestudy has suggested that the two most important variables affecting the delivery time (y) are thenumber of cases of product stocked (x1) and the distance walked by the route driver (x2). Thecollected 25 observations on delivery time are shown in the following table. Use any software to do the calculations like Excel. But please show all thedetailed stepsarrow_forwardA study was conducted to assess the impact of nutrient enrichment on zooplankton densities in A & B Islands. An ecologist sampled populations of zooplankton in these two locations and observed the nutrient enrichment level was higher in A island when compared with the level in B island. It is predicted the zooplankton densities in A island will be greater than those found in B island.arrow_forward
- If the data analyst hypothesizes that grocery sales are higher when payment is made using credit cards compared to cash payment, the null hypothesis would likely state that grocery sales are lower when payment is made using credit cards compared to cash payment. T/Farrow_forwardIn a study of exhaust emissions from school buses, the pollution intake by passengers was determined for a sample of nine school buses used in the Southern California Air Basin. The pollution intake is the amount of exhaust emissions, in grams per person per million grams emitted, that would be inhaled while traveling on the bus during its usual 18-mile18-mile trip on congested freeways from South Central LA to a magnet school in West LA. (In comparison, a city of 11 million people will inhale a total of about 1212 grams of exhaust per million grams emitted.) The amounts for the nine buses when driven with the windows open are given in the table. 1.15 0.33 0.40 0.33 1.35 0.38 0.25 0.40 0.35 A good way to judge the effect of outliers is to do your analysis twice, once with the outliers and a second time without them. Give the 90%90% confidence interval with all the data for the mean pollution intake among all school buses used in the Southern California Air Basin that…arrow_forwardIt has been shown that the fertilizer magnesium ammonium phosphate, Mg, NH4PO4, is an effective supplier of the nutrients necessary for plant growth. A study was conducted at George Mason University to determine a possible optimum level of fertilization, based on the enhanced vertical growth response of the chrysanthemums. Forty chrysanthemum seedlings were divided into four groups, each containing 10 plants. Each was planted in a similar pot containing a uniform growth medium. To each group of plants an increasing concentration of Mg,NH4PO4, measured in grams per bushel, was added: 50 g/bu, 100 g/bu, 200 g/bu, and 400g/bu. The sample means for each group was 15.34 cm, 17.16 cm, 18.3 cm, and 20.1 cm, respectively. Here SST = 758.035. (a) Construct the ANOVA table. (b) Use the Bonferroni correction to construct all g pairwise confidence intervals with t a df 2.792. What is a?arrow_forward
 MATLAB: An Introduction with ApplicationsStatisticsISBN:9781119256830Author:Amos GilatPublisher:John Wiley & Sons Inc
 Probability and Statistics for Engineering and th...StatisticsISBN:9781305251809Author:Jay L. DevorePublisher:Cengage Learning
 Statistics for The Behavioral Sciences (MindTap C...StatisticsISBN:9781305504912Author:Frederick J Gravetter, Larry B. WallnauPublisher:Cengage Learning
 Elementary Statistics: Picturing the World (7th E...StatisticsISBN:9780134683416Author:Ron Larson, Betsy FarberPublisher:PEARSON
 The Basic Practice of StatisticsStatisticsISBN:9781319042578Author:David S. Moore, William I. Notz, Michael A. FlignerPublisher:W. H. Freeman
 Introduction to the Practice of StatisticsStatisticsISBN:9781319013387Author:David S. Moore, George P. McCabe, Bruce A. CraigPublisher:W. H. Freeman